
City map analysis template
A structured template for presenting site conditions, context, and key insights.
 by Nadia from Rayon
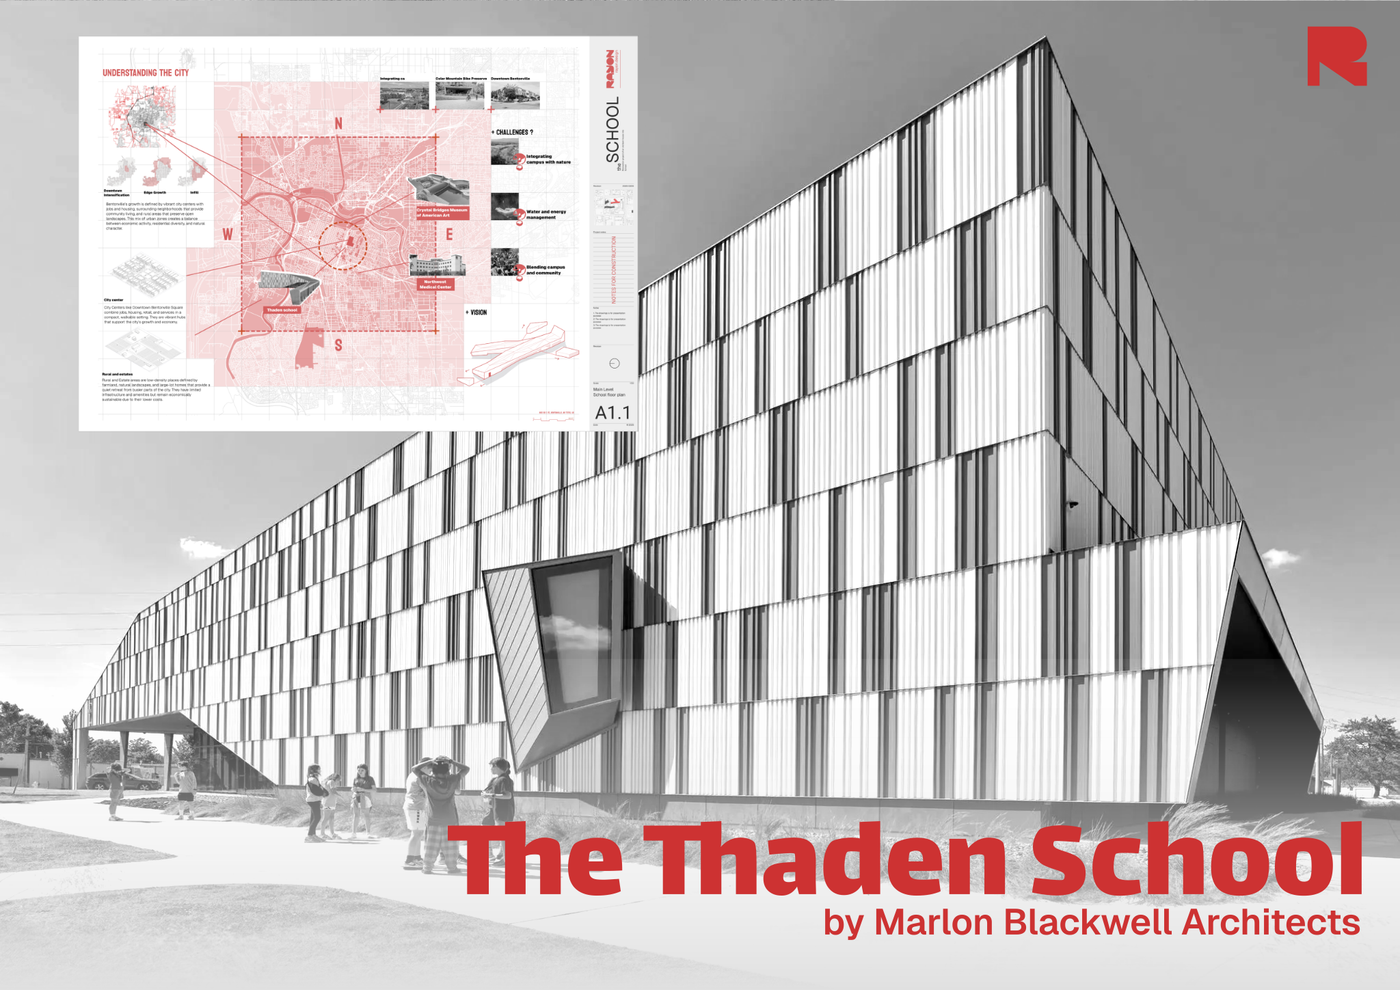
About this template
This template is designed for architecture and urban planning students who need to document, analyze, and present site context and urban research. Mapping wider city dynamics often requires substantial drafting preparation. This framework streamlines the process by establishing a clear structure to evaluate site conditions, urban growth, and design challenges for studio reviews and presentations.
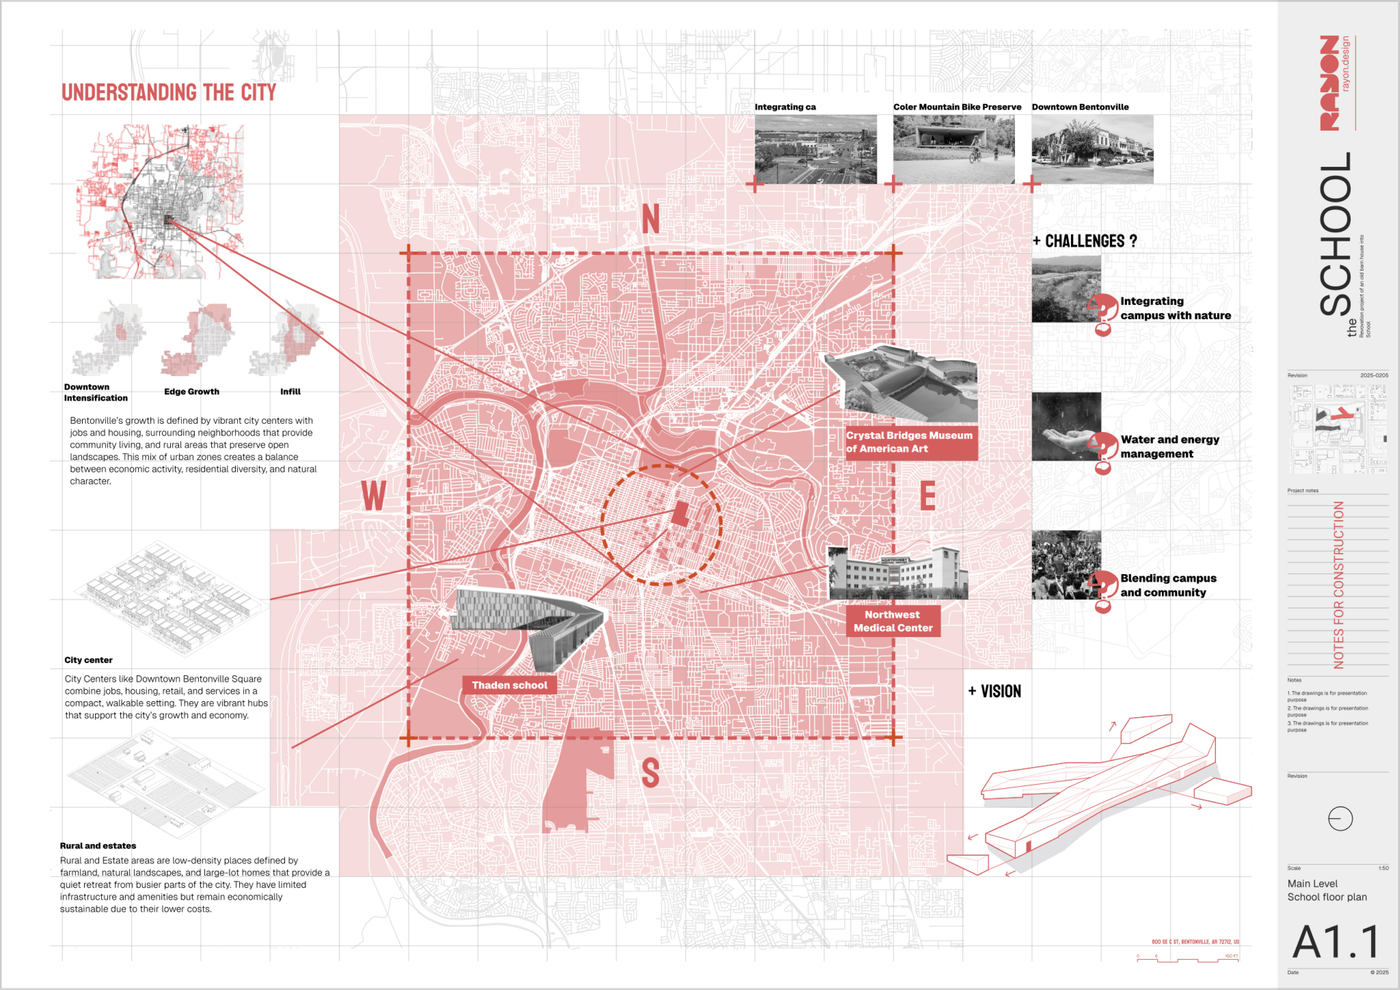
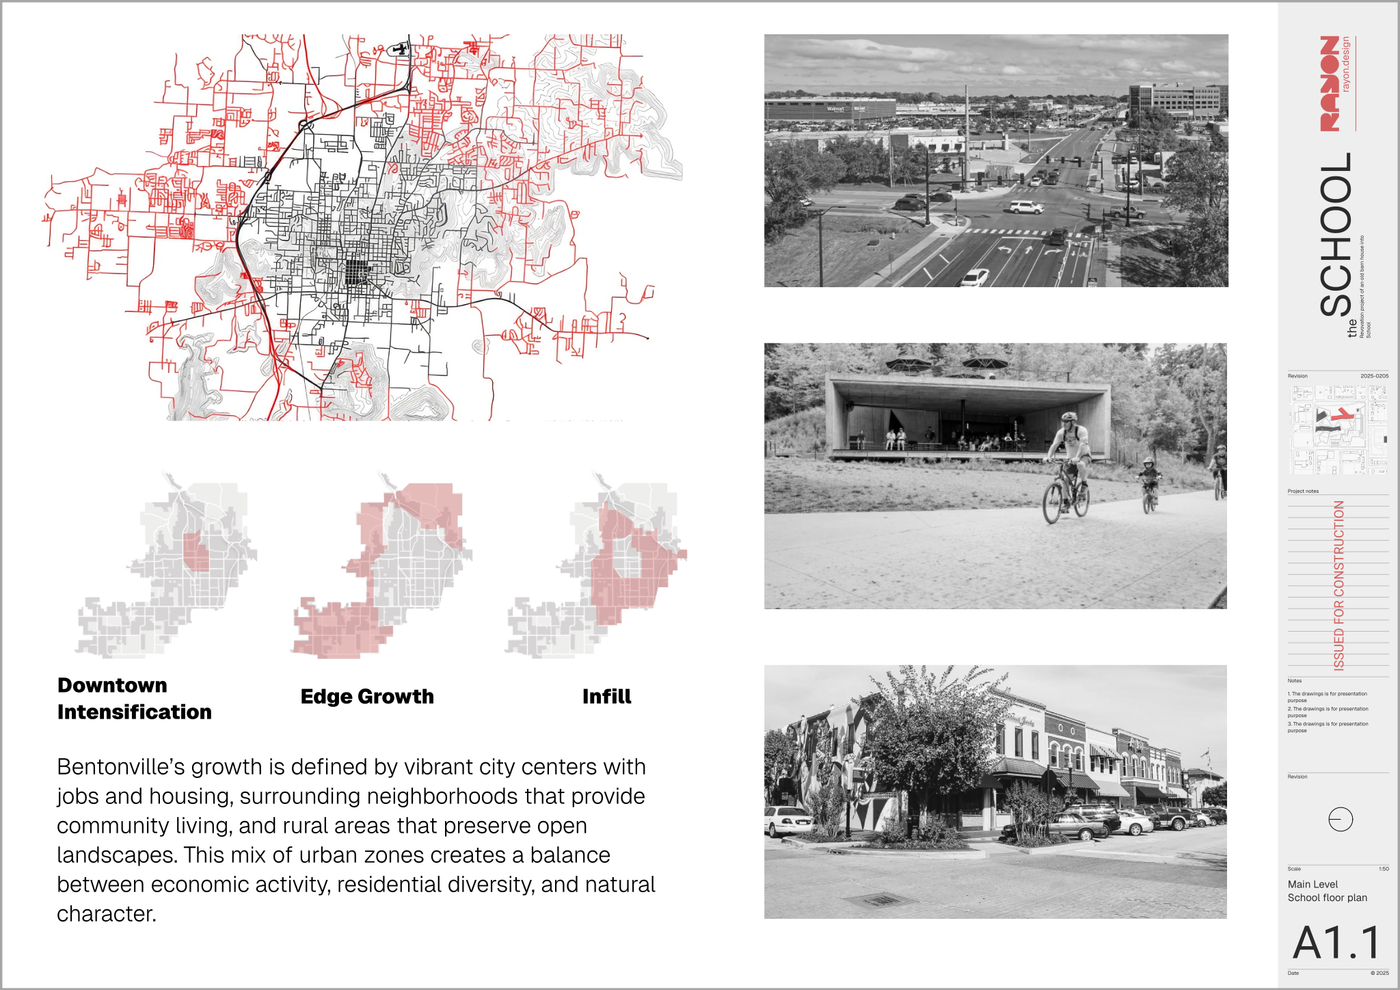
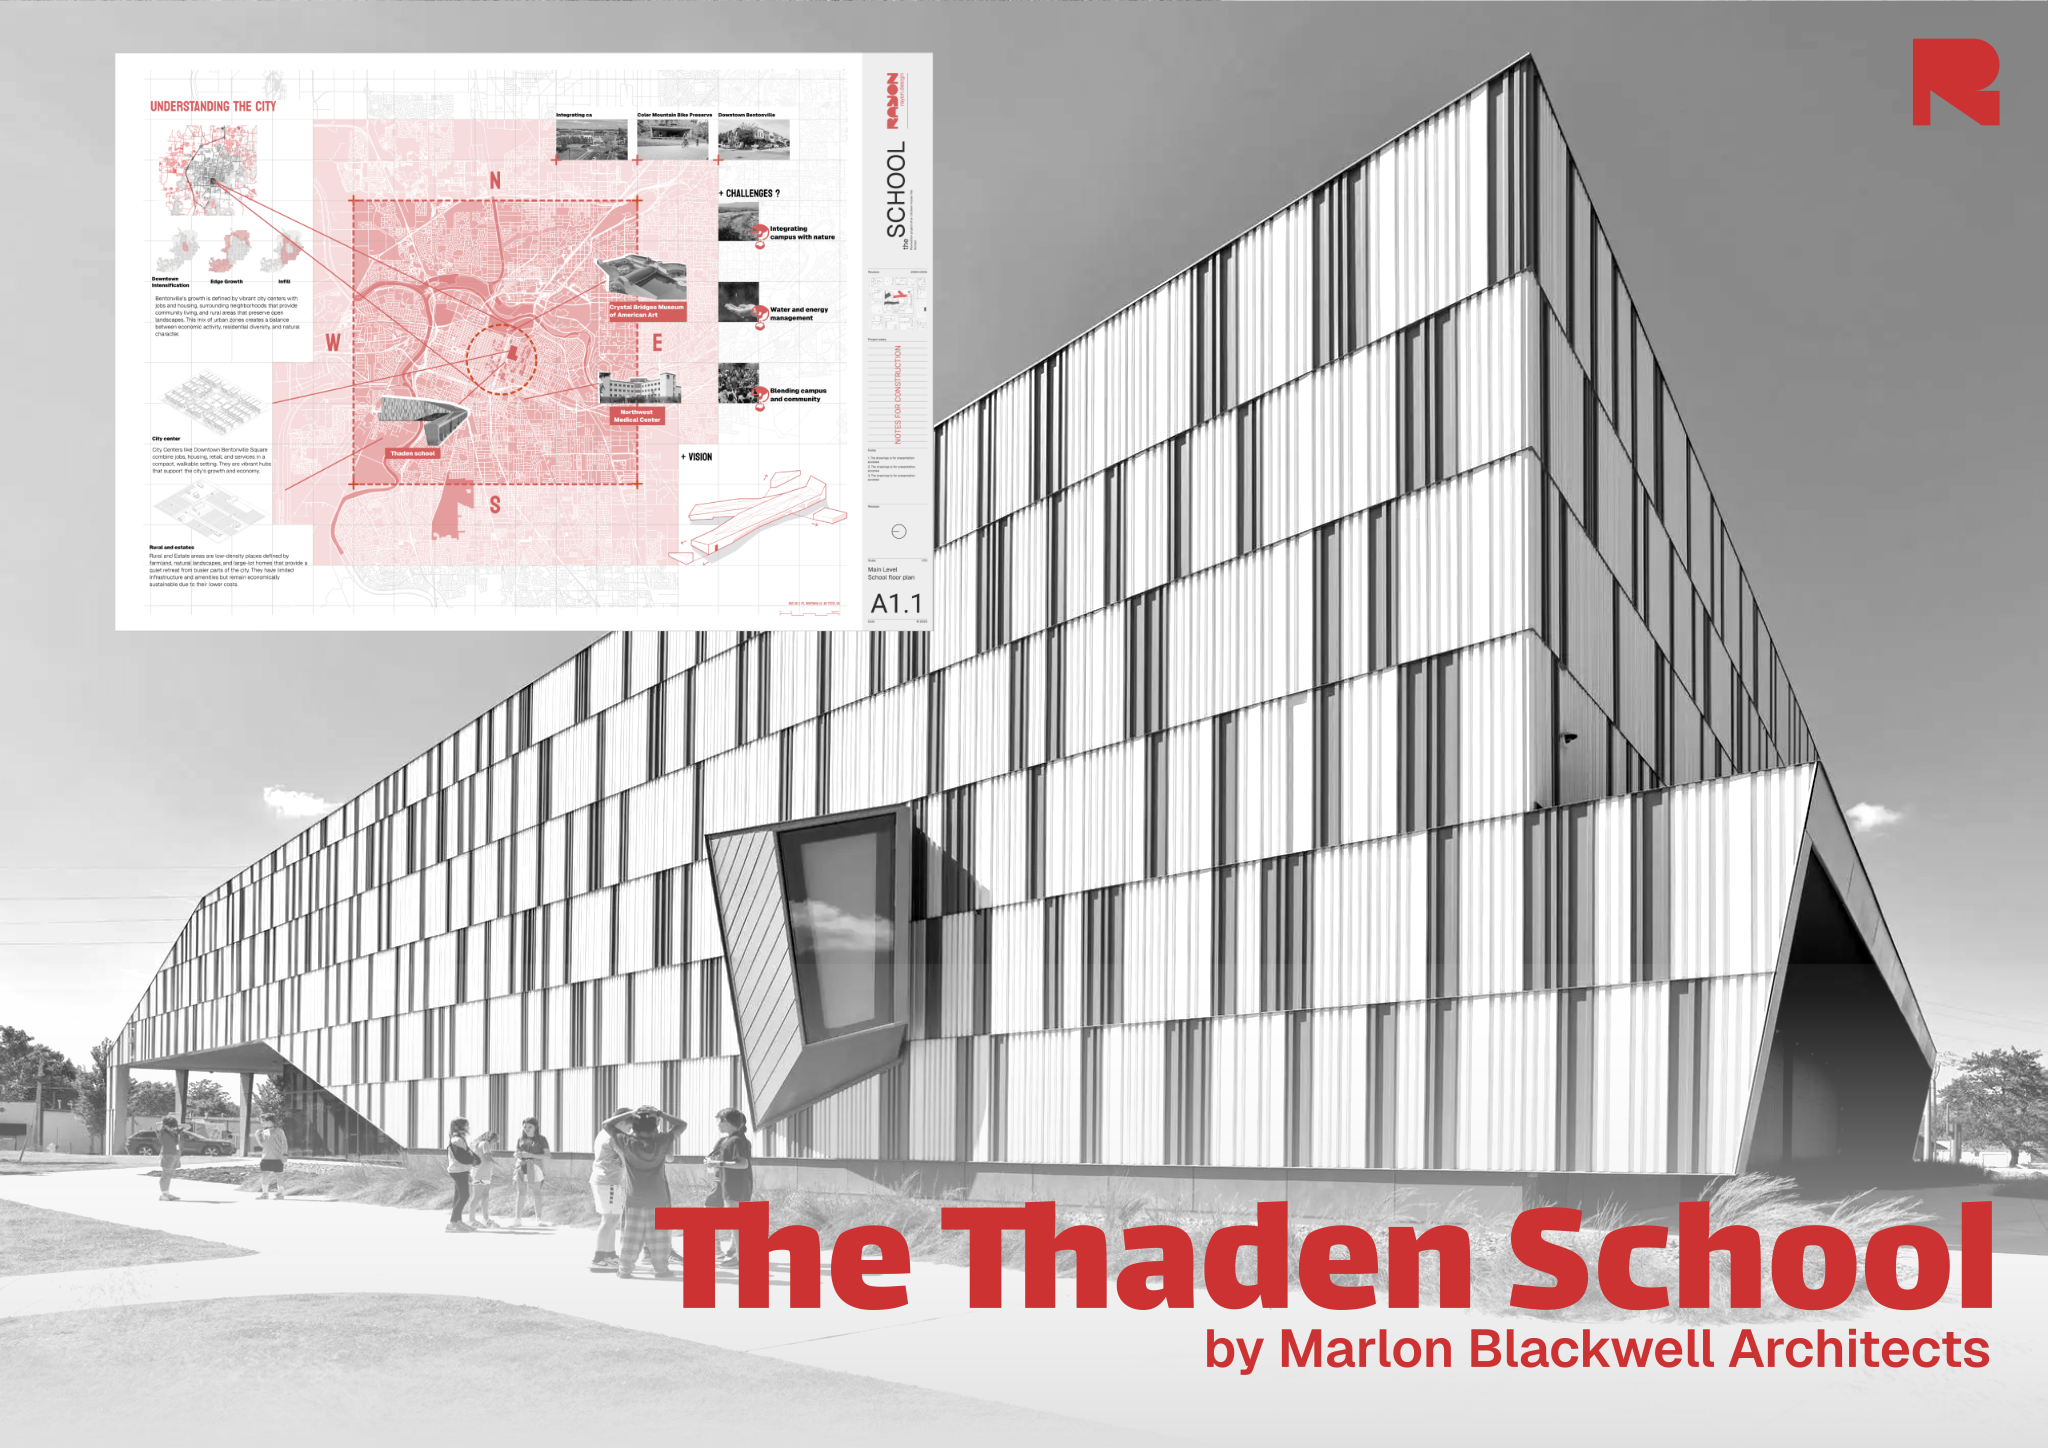
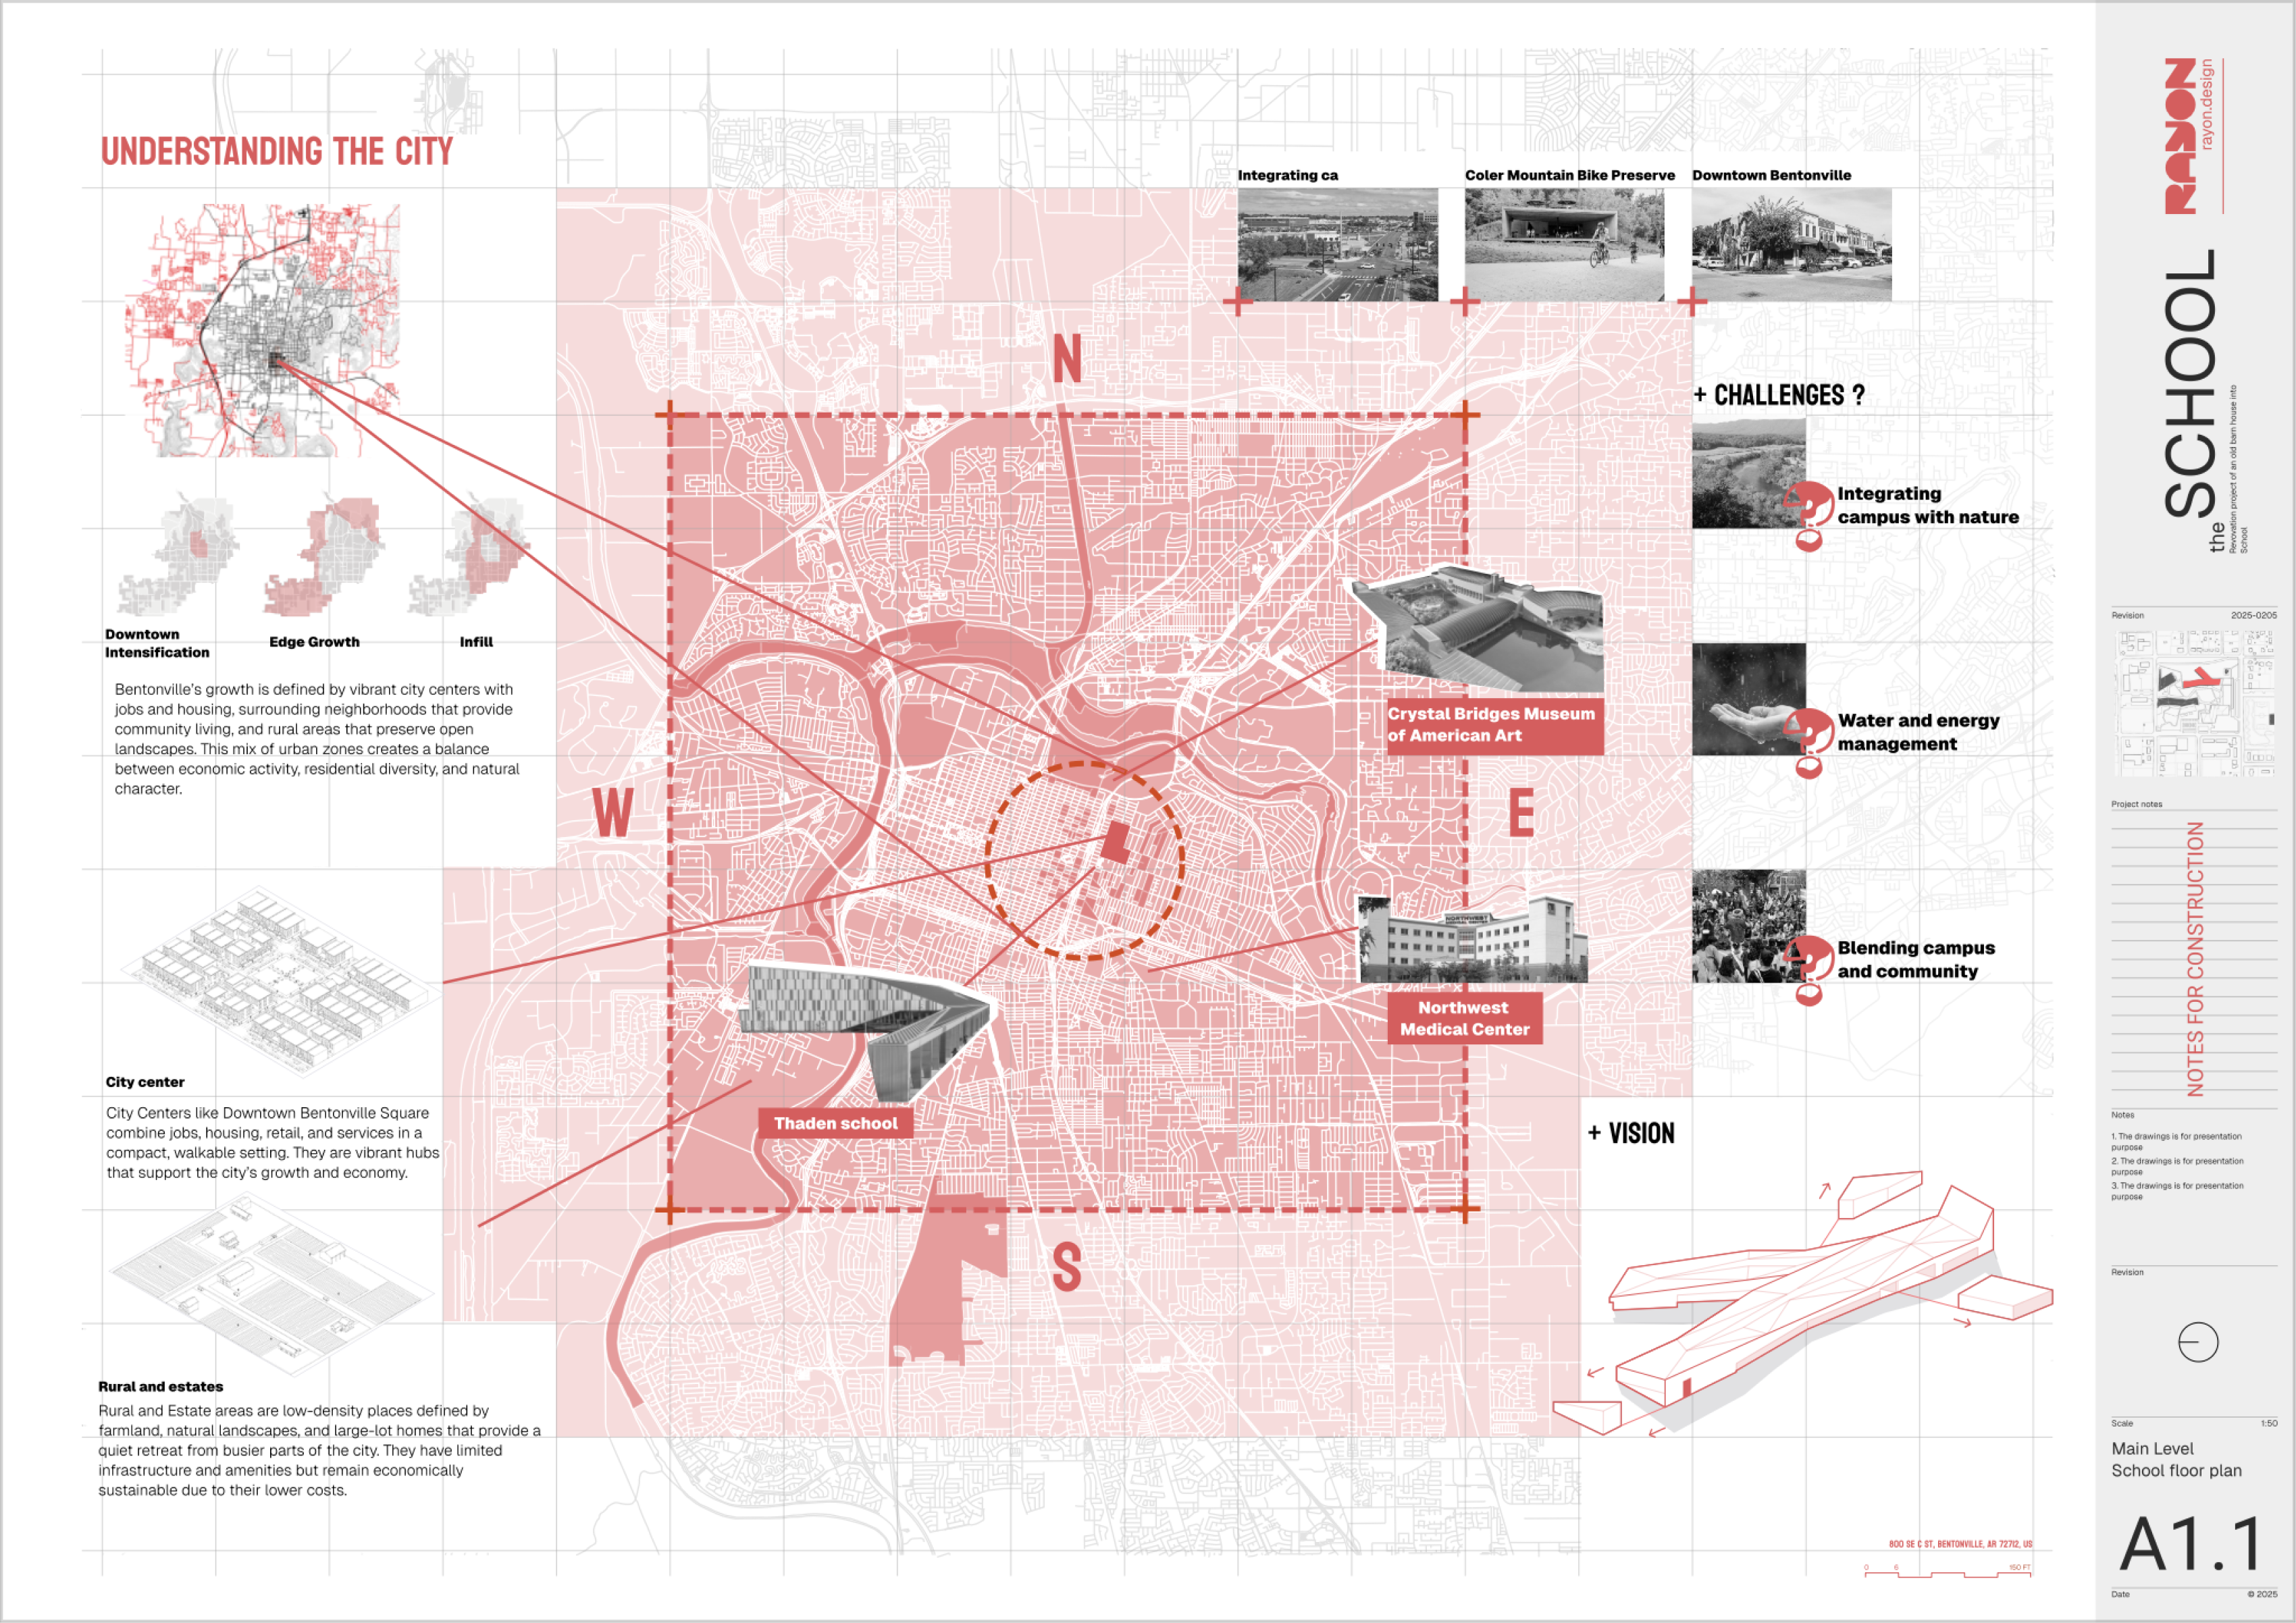
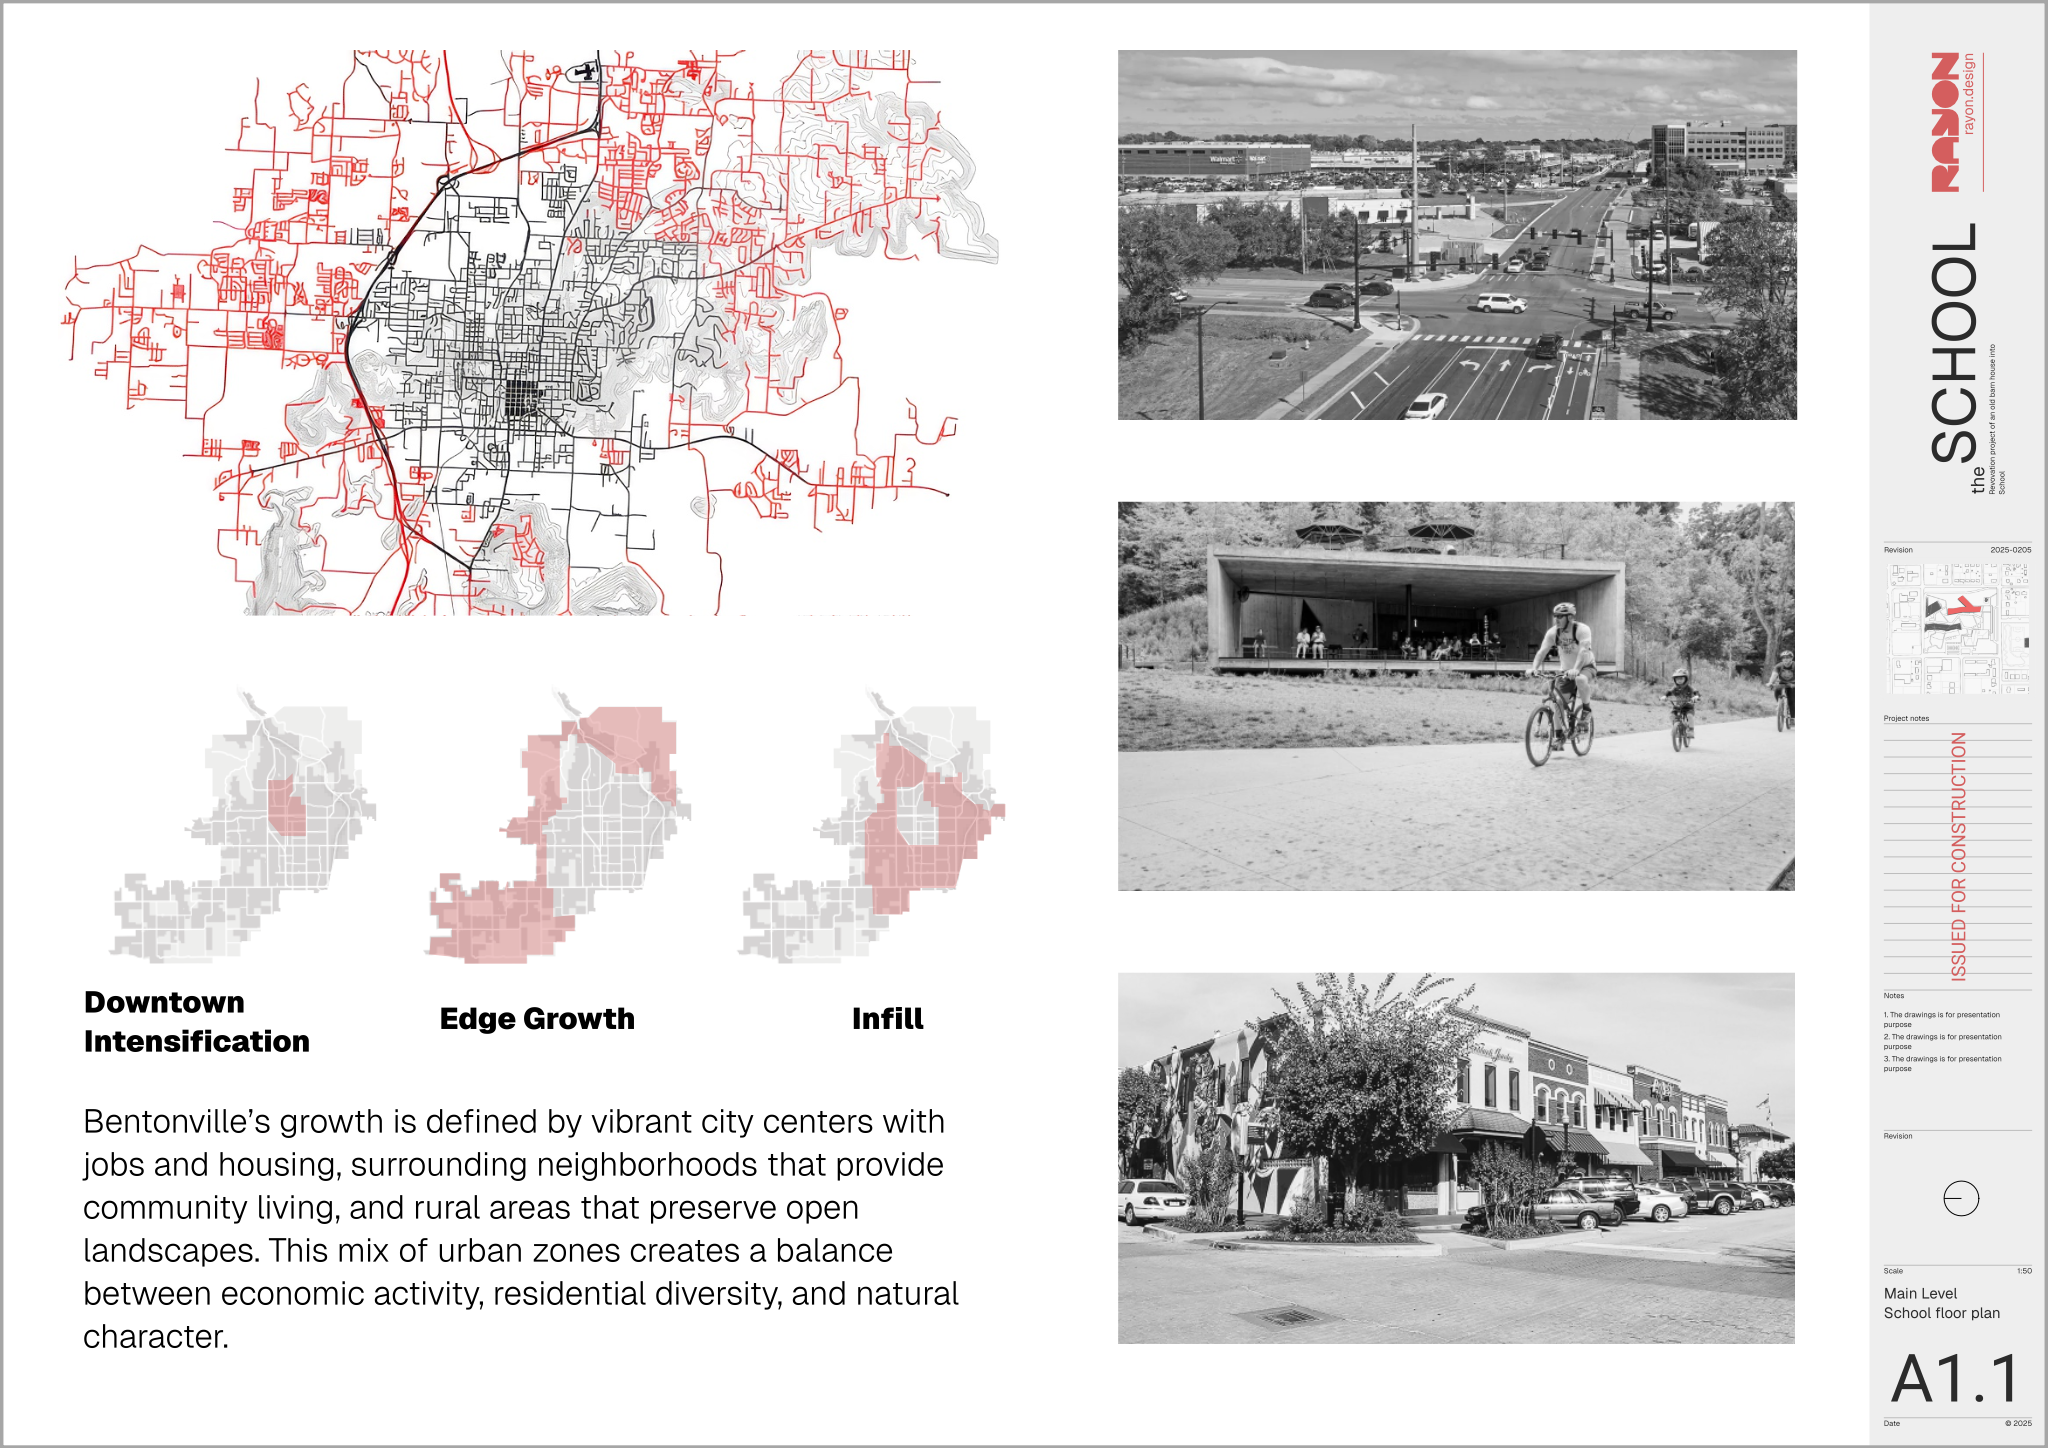
It contains a context map illustrating the building location within the surrounding urban fabric alongside important landmarks. Graphic city growth analyses represent downtown intensification, edge growth, and infill zones, complemented by diagrammatic visualizations that highlight site conditions, challenges, and opportunities. Detailed textual descriptions accompany the drawings to explain core concepts, supported by a block and style library, layer lists, line weights, and print settings.
Open the City map analysis template directly in Rayon, a browser-based CAD tool, to customize it for your project. You can modify the linework to fit your site boundaries, adapt the text and diagrams to reflect your findings, reuse the standardized blocks and styles, and export or print your sheets using the integrated print settings.
What's included
- Context map illustrating the building's location within the city and surrounding areas, highlighting important landmarks.
- City growth analysis with graphic representations of downtown intensification, edge growth, and infill zones guiding urban development strategies.
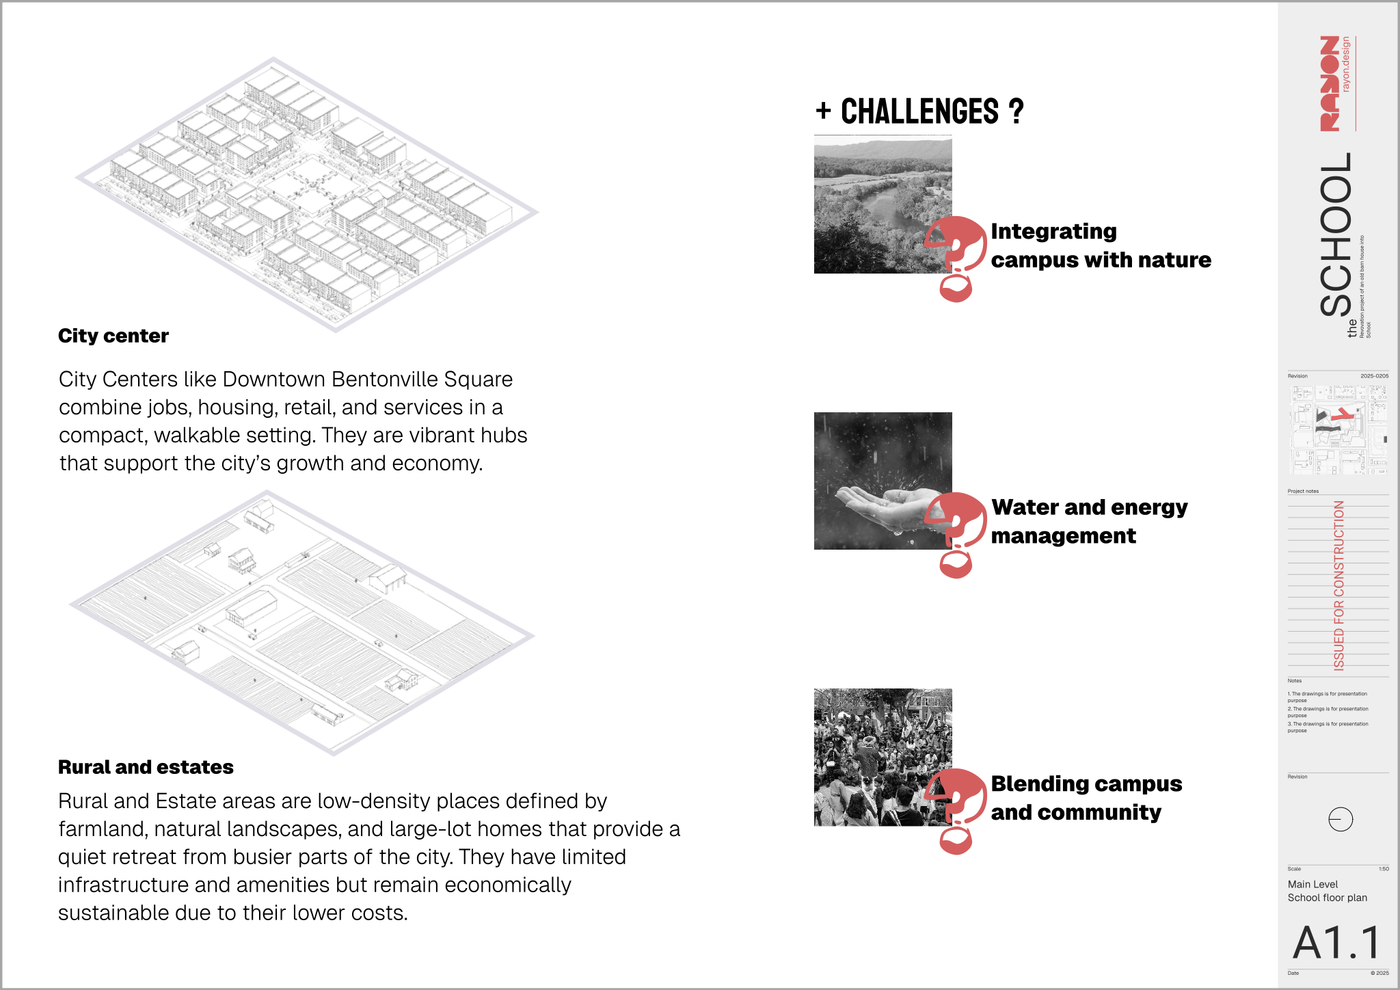
- Diagrammatic visualizations providing conceptual understanding of site conditions, challenges, and design opportunities for the project.
- Detailed textual descriptions explaining key urban concepts, challenges, and proposed solutions relevant to the site mapping.
- Reusable assets include a full block and style library, model formatting with layer lists, line weights, and print settings.
Looking for more like this? Browse all student presentation templates.
Read the guide
Learn the workflow on Rayon Academy
More templates
Browse all ↗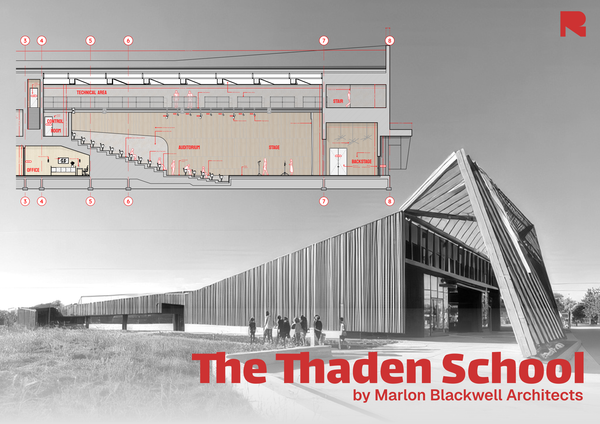
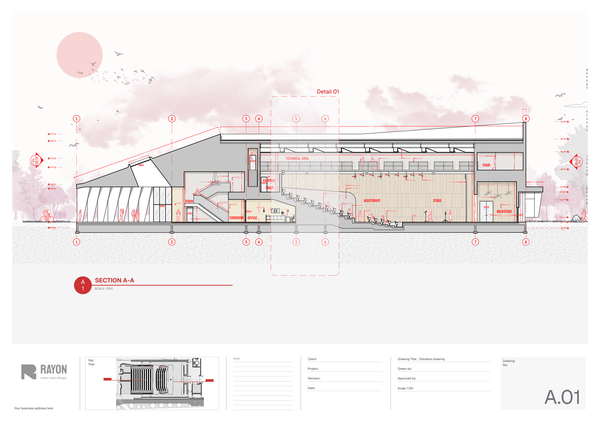
Auditorium layout
A structured template for illustrating the form, function, and experience of auditorium spaces.
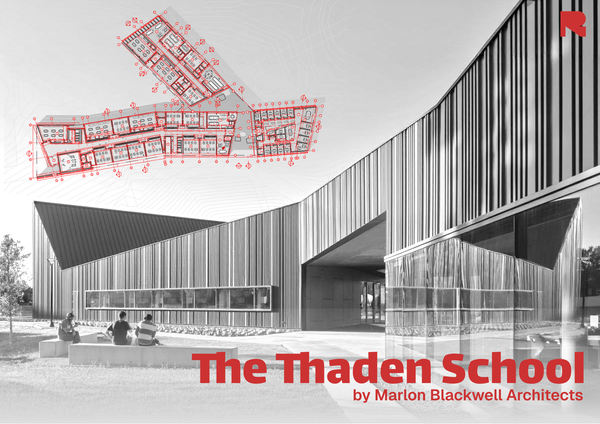
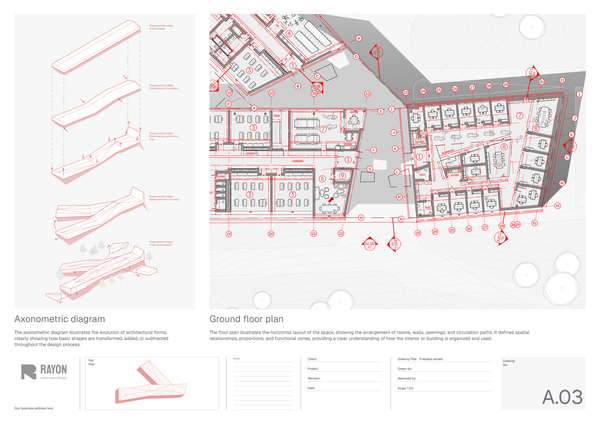
Campus design layout
A clear and organized school floor plan template for presenting educational spaces.
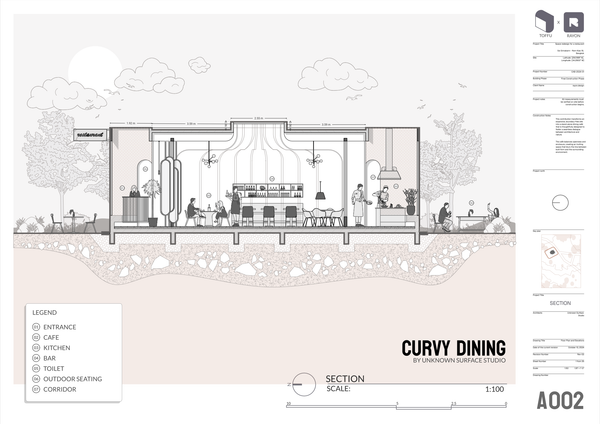
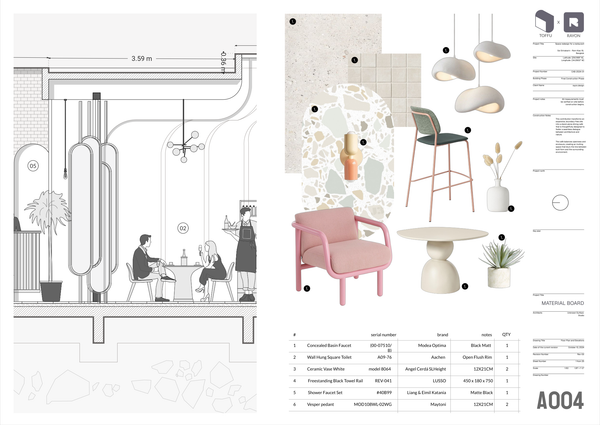
Restaurant furniture and people blocks
A selection of blocks for the restaurant project
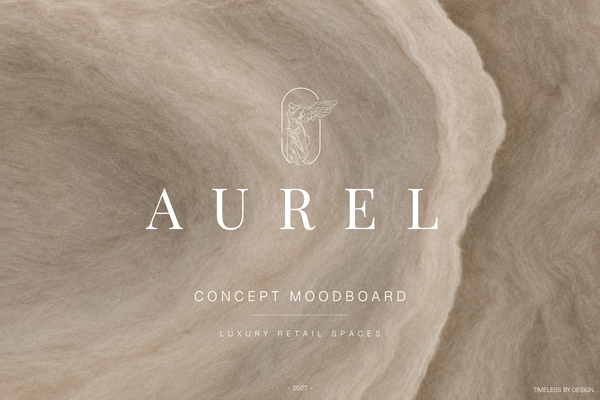
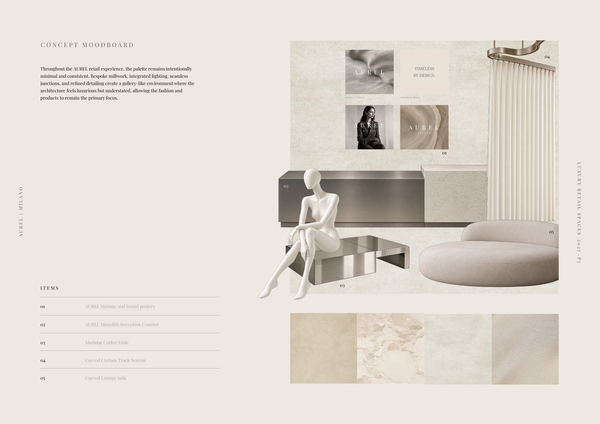
AUREL - Concept moodboard
A curated concept moodboard template for presenting the visual identity, materials, colors, and atmosphere of a luxury retail space.

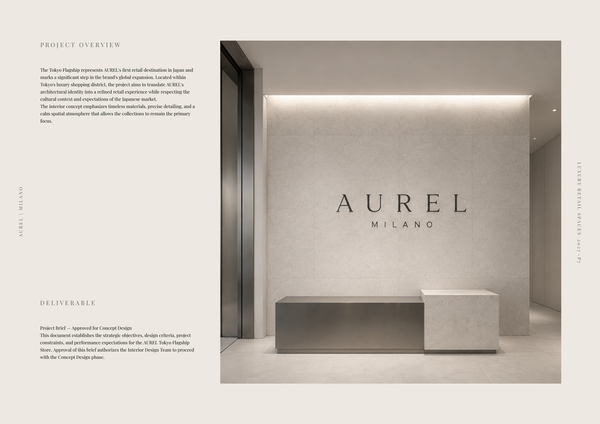
AUREL - Concept deck
A concept deck template for presenting the brand vision, spatial experience, materials, and design direction of a luxury retail space.
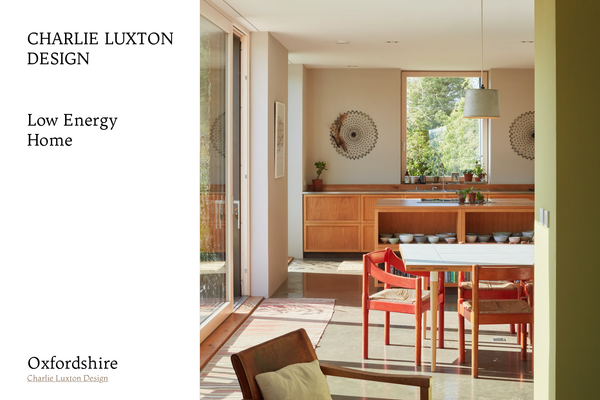
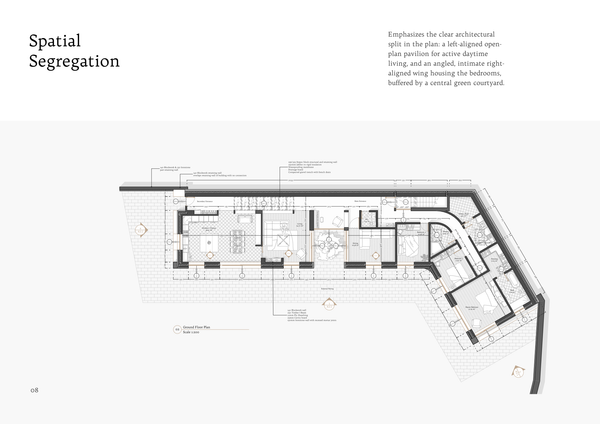
Charlie Luxton - Low energy home
A real-project template showcasing Charlie Luxton Design’s Low Energy Home through architectural drawings, details, and sustainable design solutions.
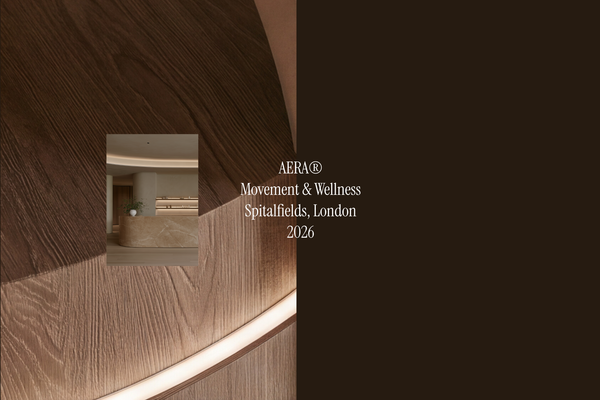
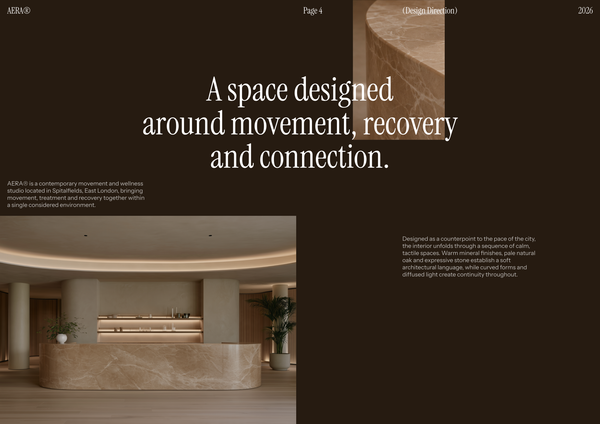
AERA - Millwork drawings
A detailed millwork drawing template for presenting custom reception desks, storage, built-ins, and bespoke joinery for a modern wellness and Pilates studio.
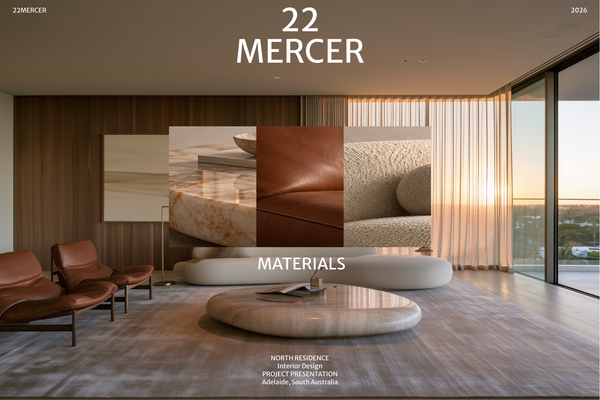
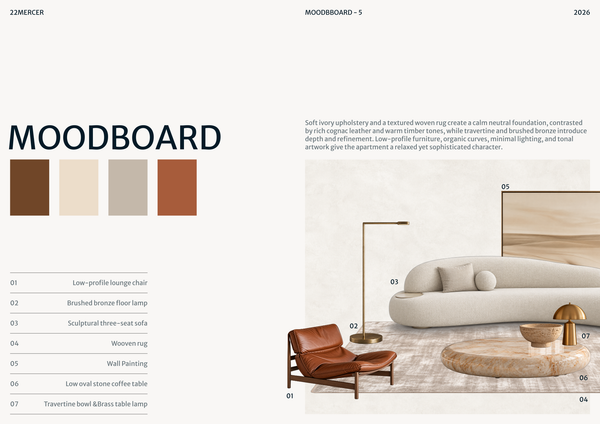
22 MERCER - Materials & FF&E
A refined Materials & FF&E template for presenting curated finishes, furniture, lighting, and fixtures for a luxury residence.
Frequently asked questions
Who is this template for?
This template is for students, designers, and architects presenting site conditions, urban context, and key insights for a building or urban development project. It suits work that maps a building’s location and nearby landmarks, examines downtown intensification, edge growth, and infill zones, or explains site challenges and design opportunities through diagrams and text.
How do I use this template?
Open the template in Rayon, a browser-based CAD tool, and adapt the context map, city growth graphics, diagrams, and text to your project. Reuse the block and style library, along with the layer lists, line weights, and model formatting, to organize your drawings. Then present the sheets or export or print them using the included print settings.
What does the context map show in the City map analysis template?
The context map illustrates the building’s location within the city and its surrounding areas, highlighting important landmarks. It establishes the wider urban setting for the site analysis, helping connect the project’s immediate conditions with the city context discussed in the diagrams and written descriptions.
Which urban growth patterns are covered in the city growth analysis?
The city growth analysis includes graphic representations of downtown intensification, edge growth, and infill zones. These patterns provide a framework for considering urban development strategies. Alongside the context map, they help explain how the project’s location relates to different forms of change within the city.
What do the diagrammatic visualizations explain about the site?
The diagrammatic visualizations provide a conceptual understanding of site conditions, challenges, and design opportunities. Their role is to communicate the main issues shaping the project rather than replace the detailed written explanations. Together, the diagrams and text connect the site analysis with opportunities for a design response.
What information belongs in the template’s textual descriptions?
The template includes detailed textual descriptions explaining key urban concepts, site-related challenges, and proposed solutions relevant to the mapping. When adapting this content, keep those explanations tied to the conditions represented in the graphics. This helps the written analysis clarify the maps and diagrams rather than introduce unrelated project information.
How do the context map, growth analysis, and site diagrams fit together?
The context map establishes where the building sits within the city, while the growth analysis examines broader development patterns. The site diagrams then communicate conditions, challenges, and opportunities relevant to the project. Detailed text supports these graphic components by explaining the urban concepts and proposed solutions behind the analysis.
Which reusable assets support consistent map and diagram formatting?
The reusable assets include a full block and style library, along with model formatting that covers layer lists, line weights, and print settings. These resources support a consistent graphic approach across the analysis. They can be reused when adapting the maps and diagrams to present a different project’s urban context.
What content should change when adapting this template to another site?
Adapt the building location, surrounding areas, and highlighted landmarks to reflect the new site. The growth graphics, site diagrams, and written descriptions should also reflect that project’s development context, challenges, and opportunities. The reusable block and style library and model formatting provide a basis for maintaining consistency while changing the analysis content.
What design decisions does the template help explain?
The template helps explain urban development strategies informed by downtown intensification, edge growth, and infill zones, as well as proposed responses to site challenges. Its maps, diagrams, and text provide a structure for presenting those connections. The emphasis is on site conditions, context, and design opportunities rather than detailed building construction decisions.