The short answer
An architecture site analysis records everything about a site that should influence the design: location and context, access and movement, sun path and climate, views, topography, vegetation, noise, existing buildings, regulations and the people who use the area. Combine desk research with at least one site visit, present the findings as a sequence of clear single-topic diagrams on the same base map and scale, each with a one-line takeaway, and finish with an opportunities and constraints plan and a few design principles that lead directly into your concept.
Why site analysis matters
 Open template
Site analysis is where your design gets its reasons. Tutors and clients both look for the link between what you found on site and what you designed: an entrance placed where people already walk, a courtyard opened to the sun, a solid wall facing the noisy road, a view framed from the main room. Analysis that does not lead anywhere is decoration.
The same applies to interior projects. For a fit-out, the “site” is the existing building: its structure, windows and orientation, ceiling heights, services, entrances, the street outside and the neighbours. A short analysis of these is the best defence for a layout decision when a client asks why the kitchen cannot go where they first imagined.
- Desk study: maps, aerial photos, planning documents, historical maps, climate data, transport data.
- Site visit: photographs, sketches, notes at different times of day, observation of how people use the place.
- Conversations: with users, neighbours, the client, local authorities where relevant.
- Synthesis: diagrams, then an opportunities and constraints plan.
What to analyse
 Open template
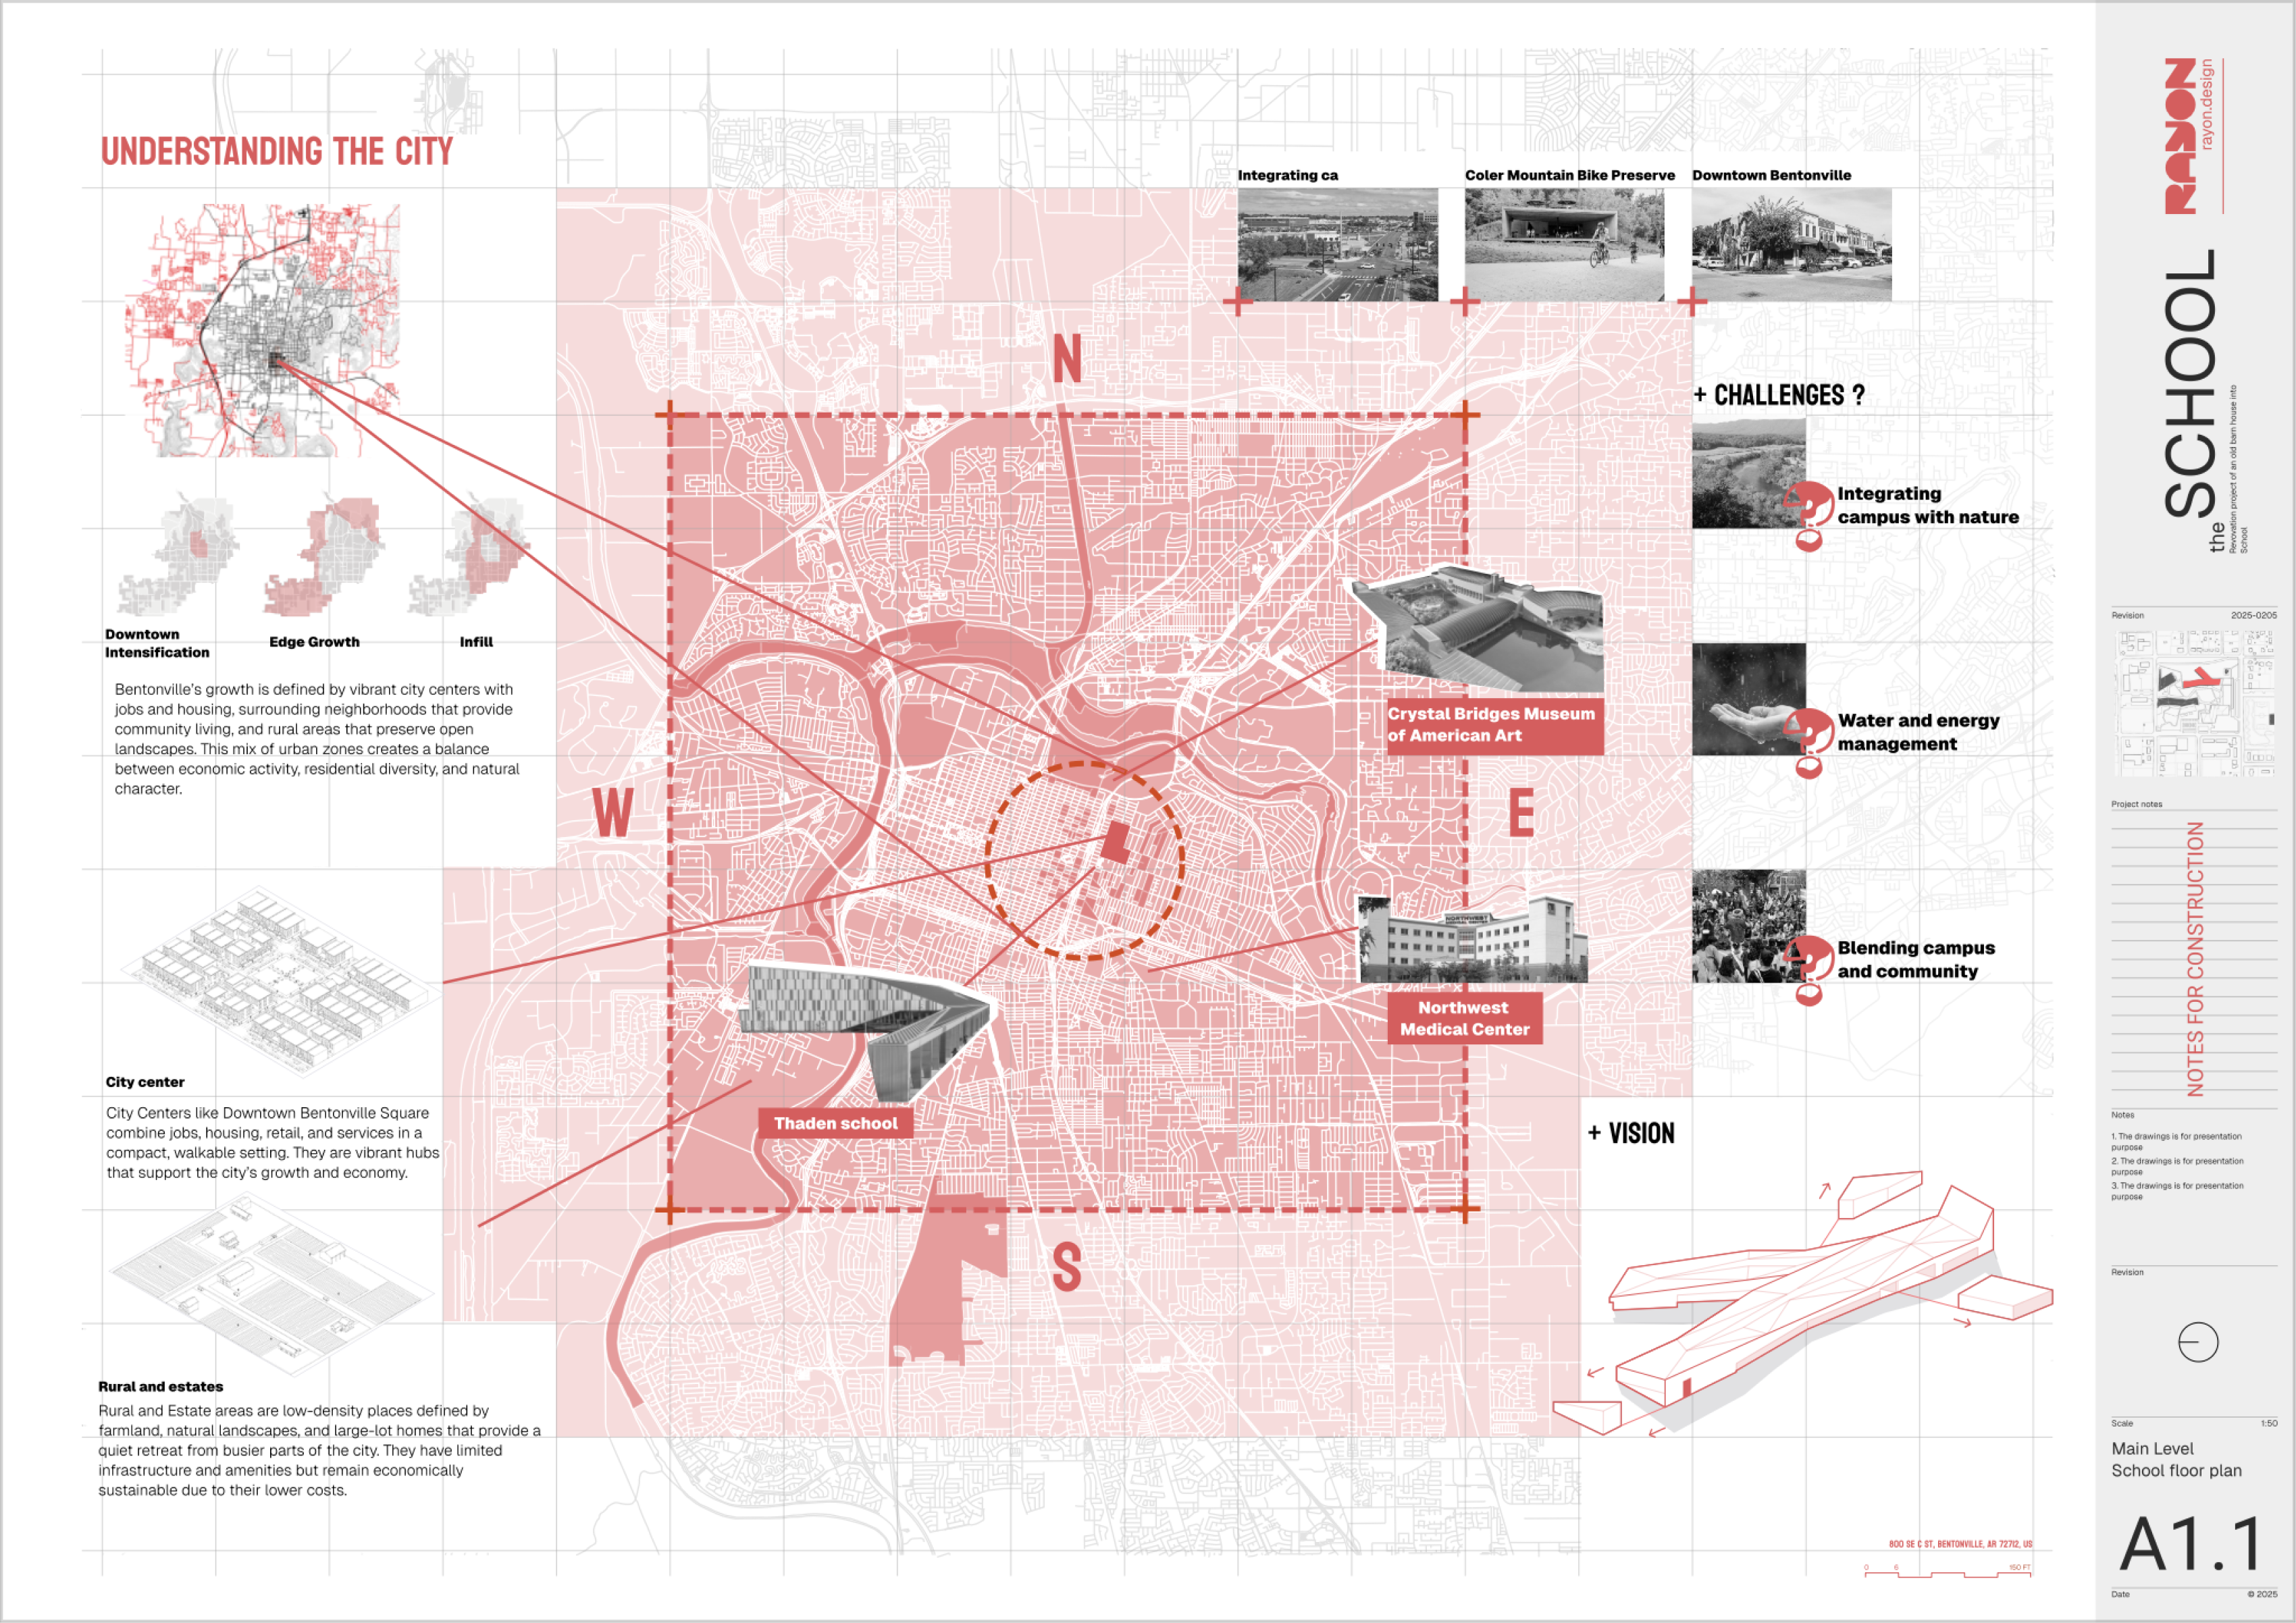
A complete site analysis covers the physical, environmental, regulatory and human sides of a site. Not every topic will matter equally, but going through the full list makes sure nothing that could shape the design is missed. Use this table as a checklist for your desk study and site visit.
| Topic | What to map |
|---|---|
| Context | Location, surrounding land uses, building heights and typologies, landmarks, character |
| Movement | Roads, public transport stops, pedestrian and cycle routes, desire lines, entrances, servicing |
| Climate | Sun path through the year, prevailing winds, rainfall, shade and overshadowing |
| Views | Views into and out of the site, what to frame and what to hide, privacy |
| Topography | Levels, slopes, drainage, flood risk |
| Landscape | Existing trees and vegetation, open spaces, ecology |
| Noise and nuisance | Traffic, rail, neighbouring activities, smells, light pollution |
| Existing buildings | Structure, condition, heritage value, what can be kept or reused |
| Regulations | Zoning, height limits, setbacks, heritage constraints, rights of way |
| People | Who uses the area, when and how; local needs and stakeholders |
You will not need every topic at the same depth. A dense urban infill site may be driven by neighbours, light and access; a rural site by landscape, slope and views; a refurbishment by the existing structure. Spend your effort where the findings will change the design.
Drawing clear analysis diagrams
 Open template
Analysis only becomes useful when other people can read it quickly. Clear diagrams turn pages of observations into a few images that a tutor, client or planning officer understands at a glance and remembers. These rules make your diagrams easy to read and to compare.
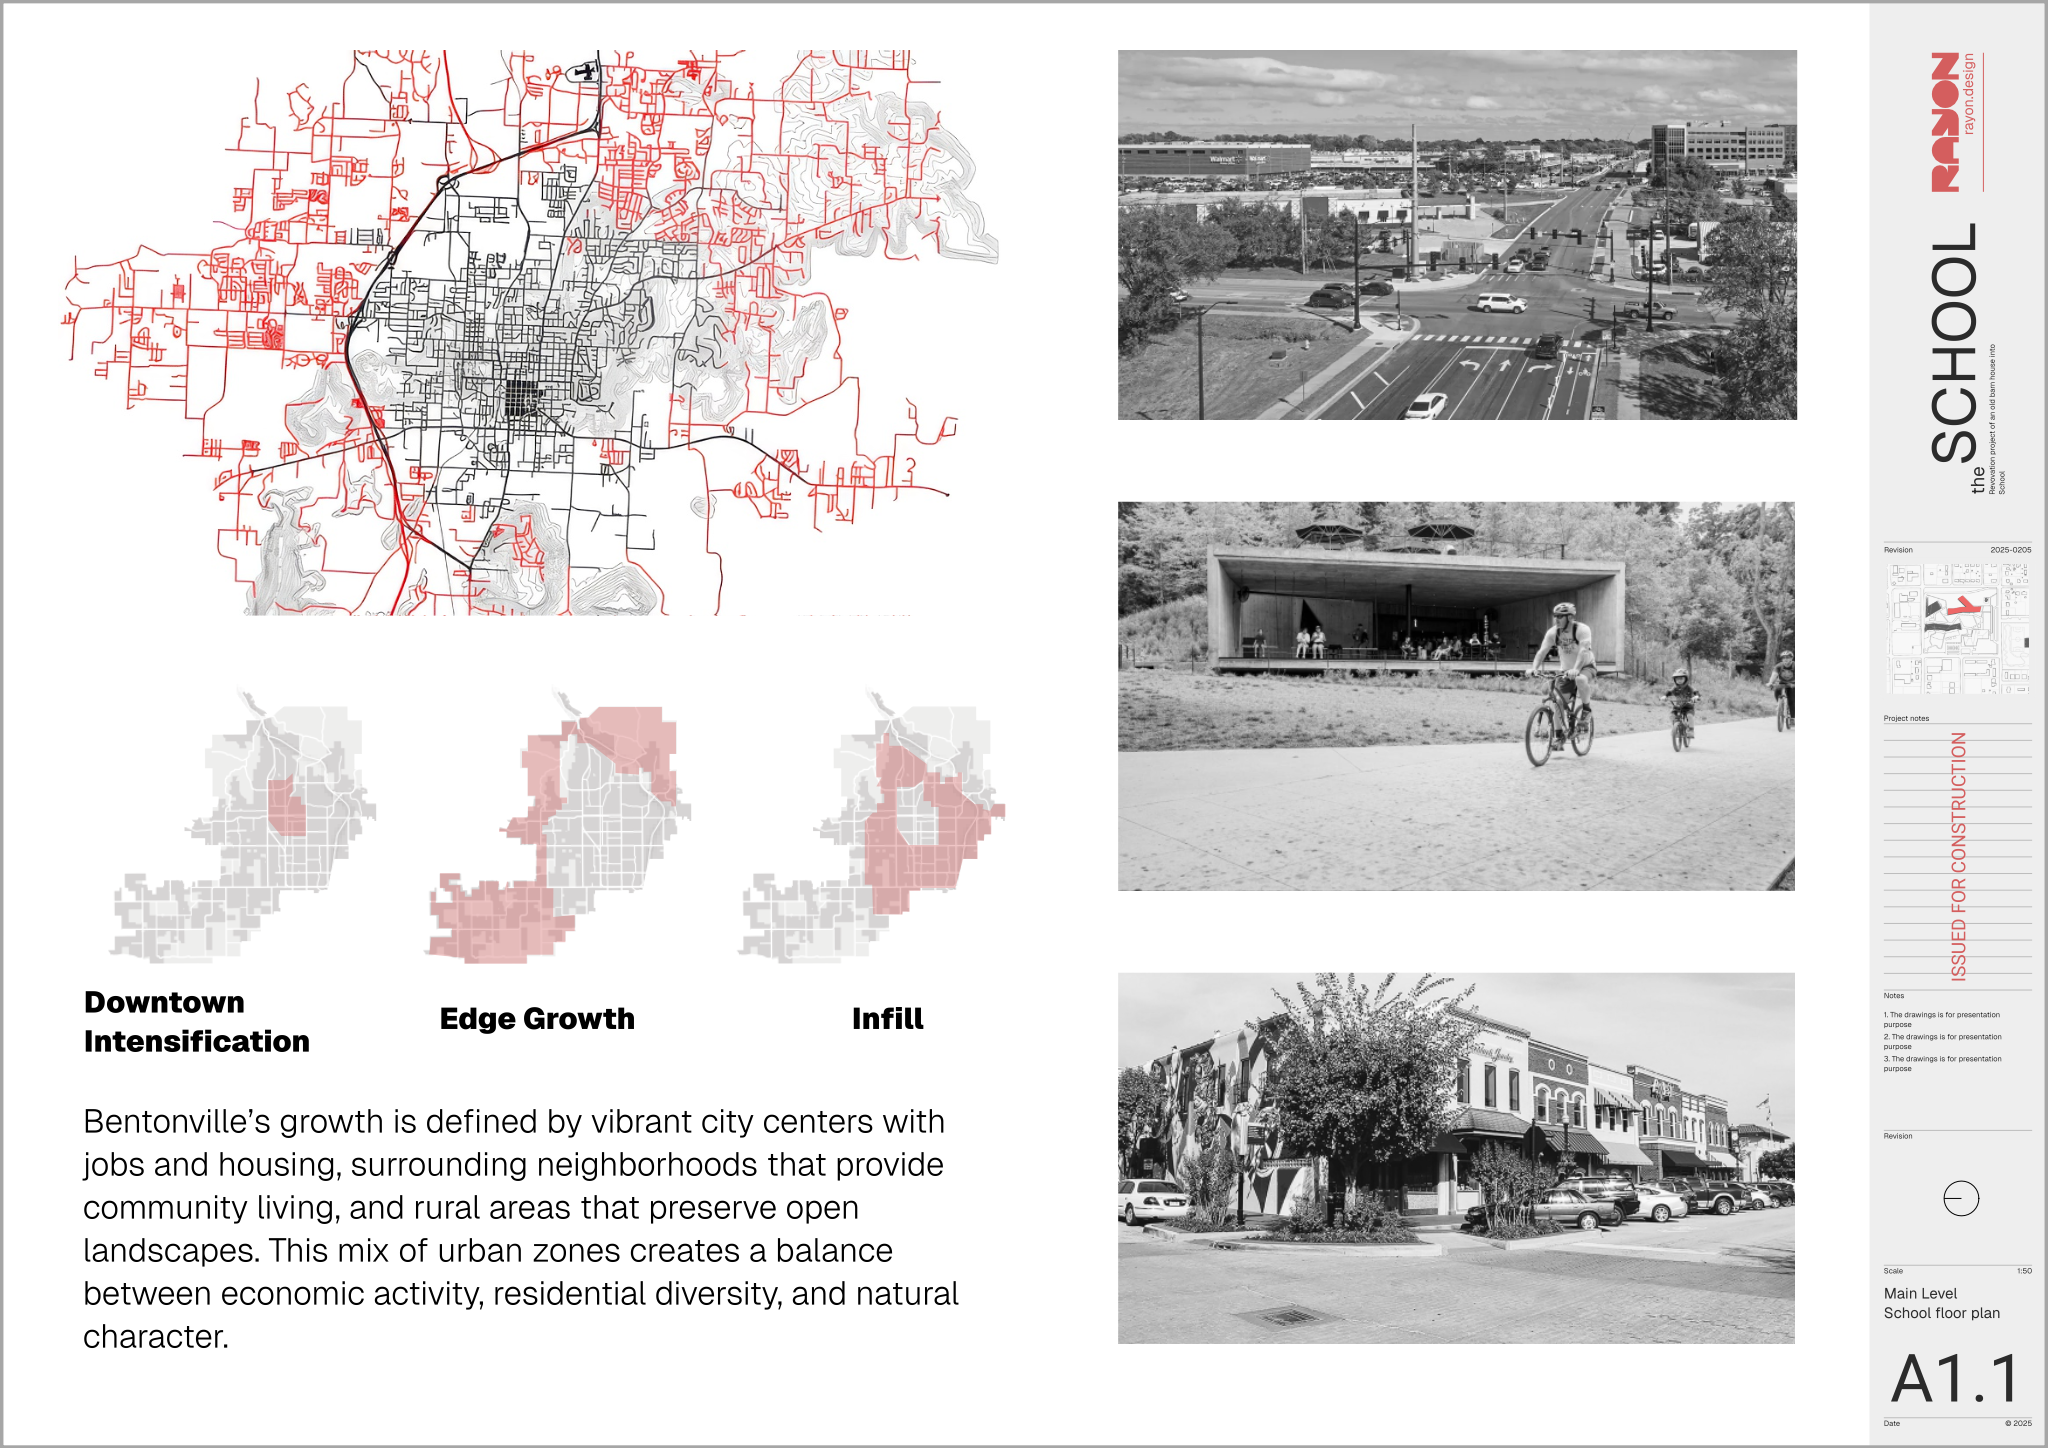
- One topic per diagram. A map trying to show everything shows nothing.
- Same base map, scale and orientation for every diagram so they can be compared side by side.
- A consistent graphic language: one colour per theme, a short legend, a north arrow and a scale bar.
- A one-line takeaway under each diagram stating what it means for the design.
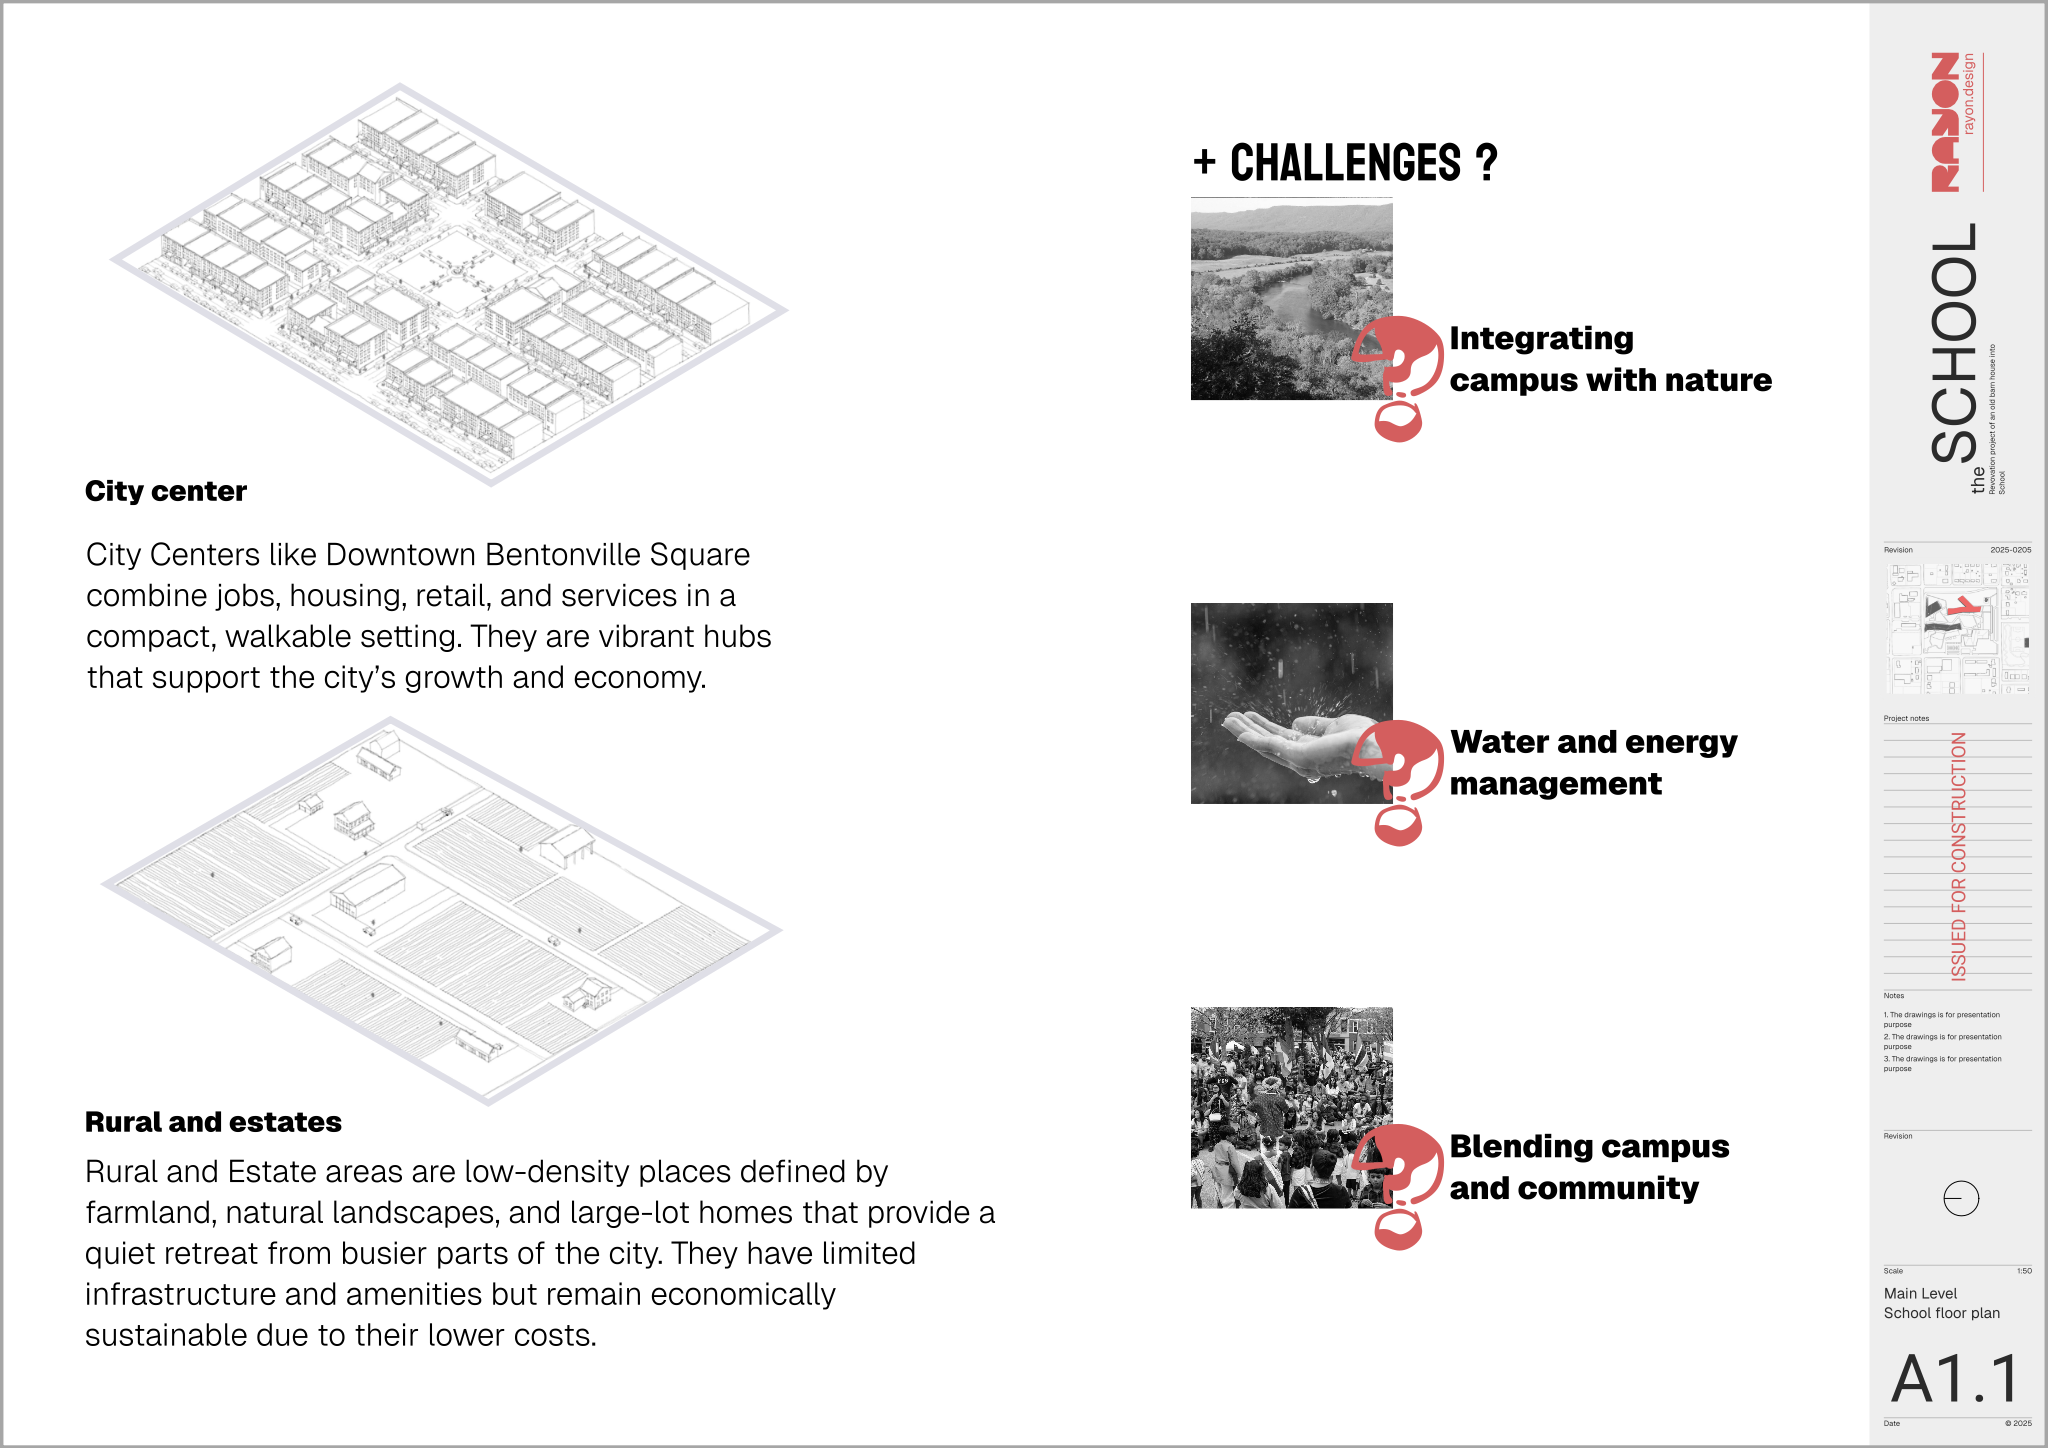
- Zoom levels: city or neighbourhood, then street, then the site itself.
- Mix plans with sections and photos: a section shows slope, building heights and sun angles better than a plan.
Common scales help readers place your work: 1:5000 or 1:2500 for the neighbourhood, 1:1250 or 1:500 for the street and block, 1:200 or 1:100 for the site itself. Keep the base map light grey so your analysis layer reads clearly on top, and remove information that does not serve the diagram.
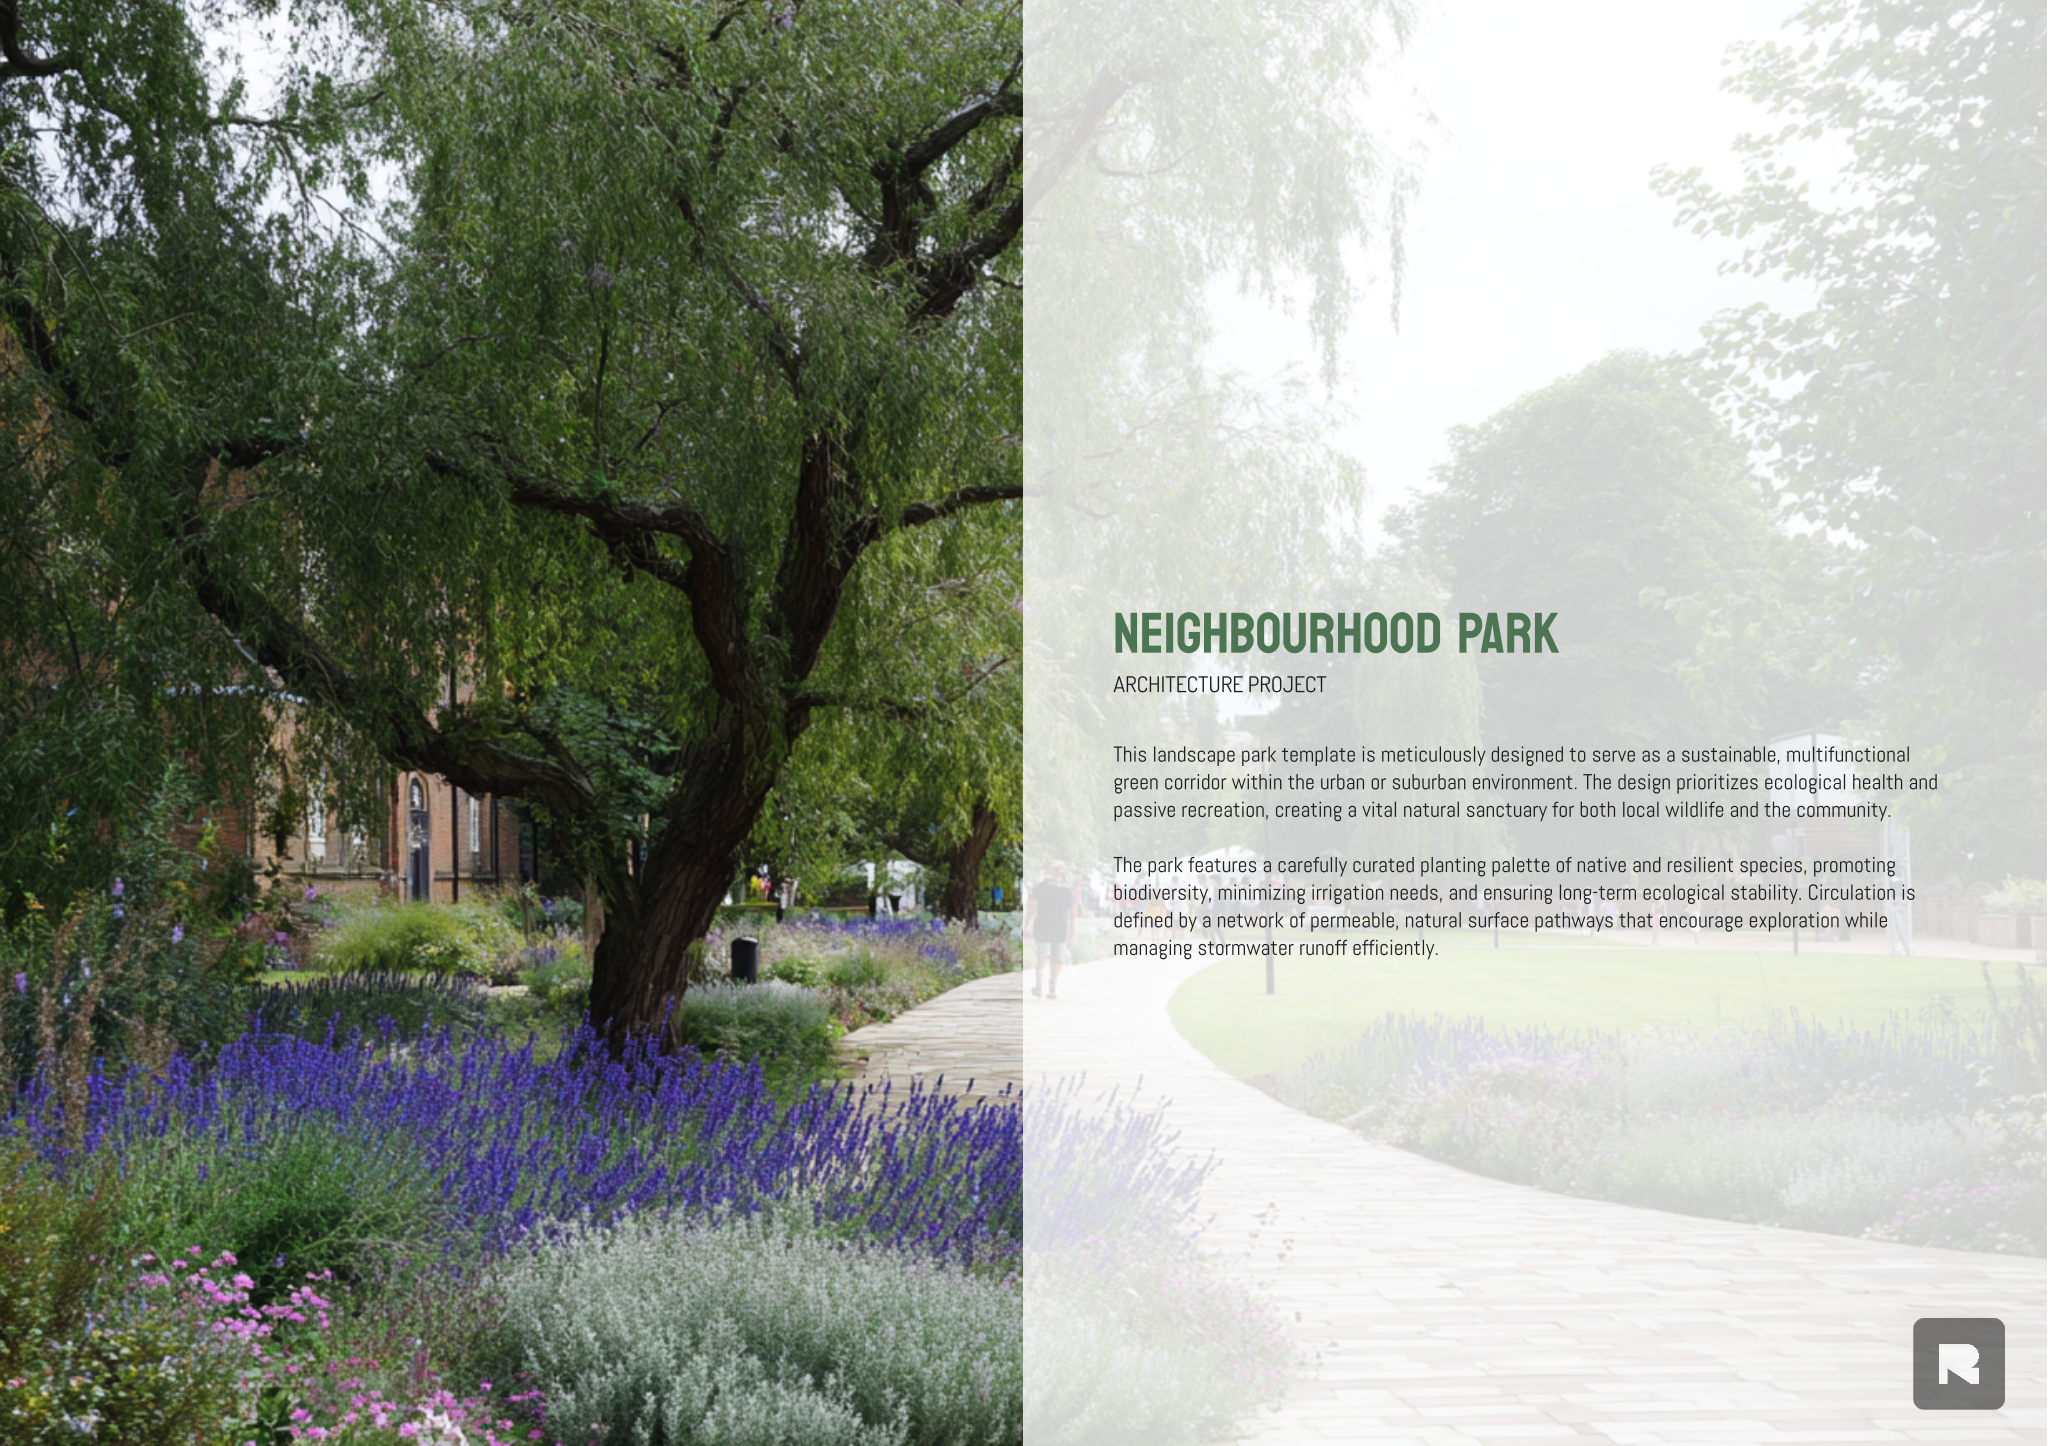
From analysis to design
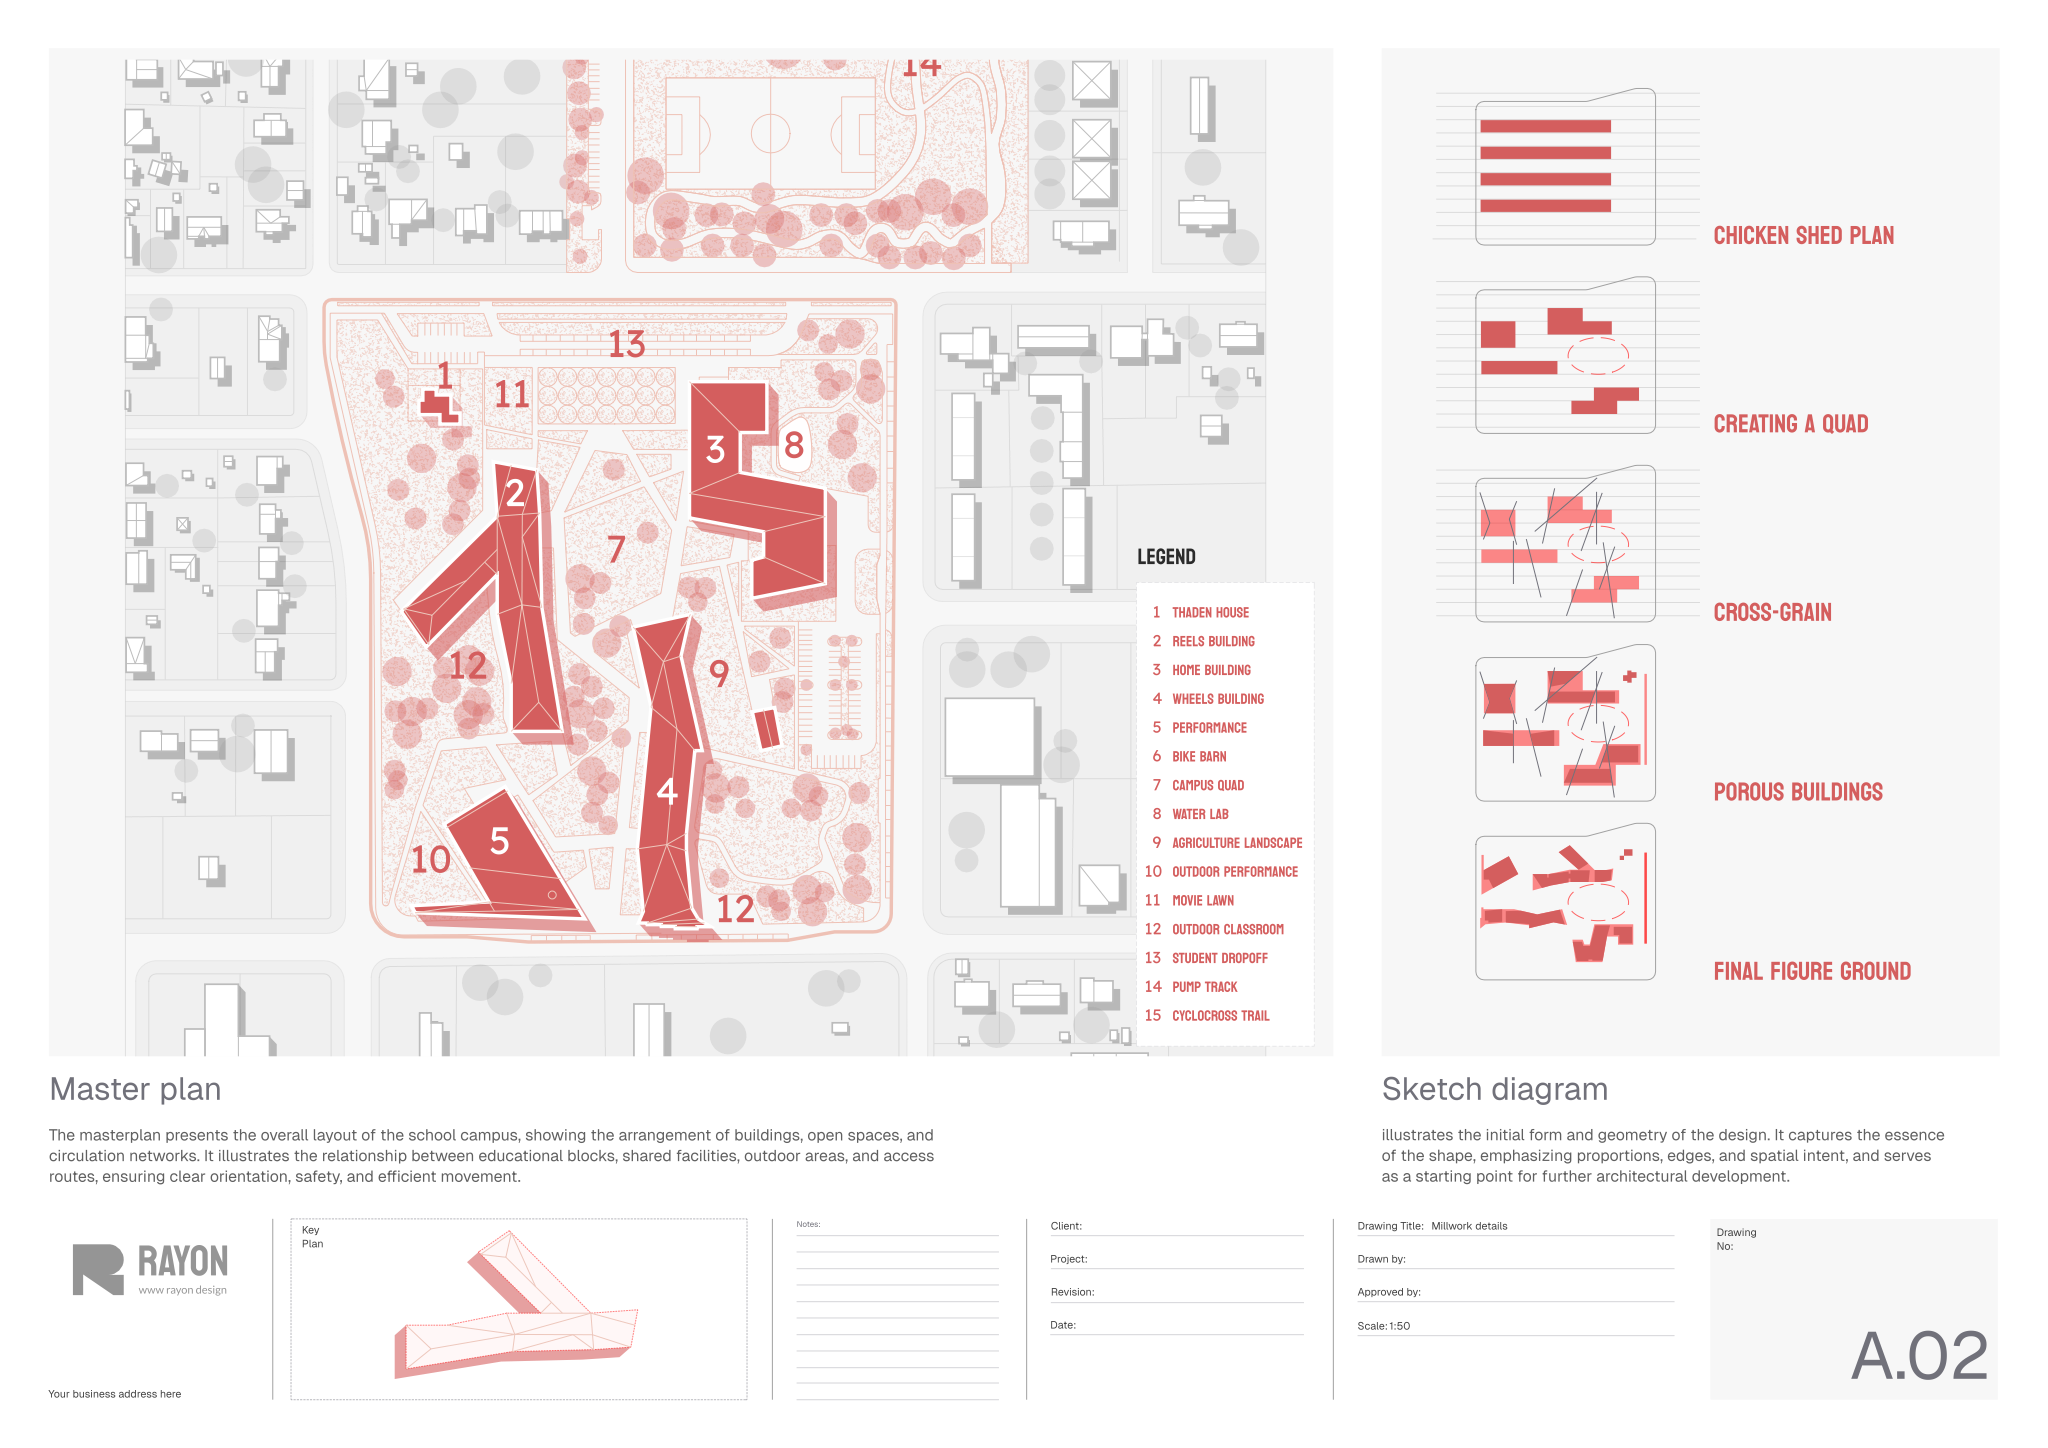
End the analysis with an opportunities and constraints plan: one drawing combining the key findings, with arrows and zones for where to build, where to open up, where to protect, where to enter. Follow it immediately with your first massing or zoning diagram so the reader sees the decisions grow out of the site.
| Finding | Possible design move |
|---|---|
| Busy road to the north | Place circulation and service spaces as a buffer on that side |
| Strong desire line across the site | Keep it as a public route or make it the main entrance |
| Mature trees in the south-west corner | Keep them and organise outdoor space around their shade |
| Long views to the south-east | Orient the main living or public spaces towards them |
| Height limit and neighbours close by | Step the massing down towards the neighbours |
Write three to five design principles derived from the analysis (“keep the existing trees and organise the plan around them”). They make a strong bridge page between analysis and concept.
Using site analysis in your student portfolio
 Open template
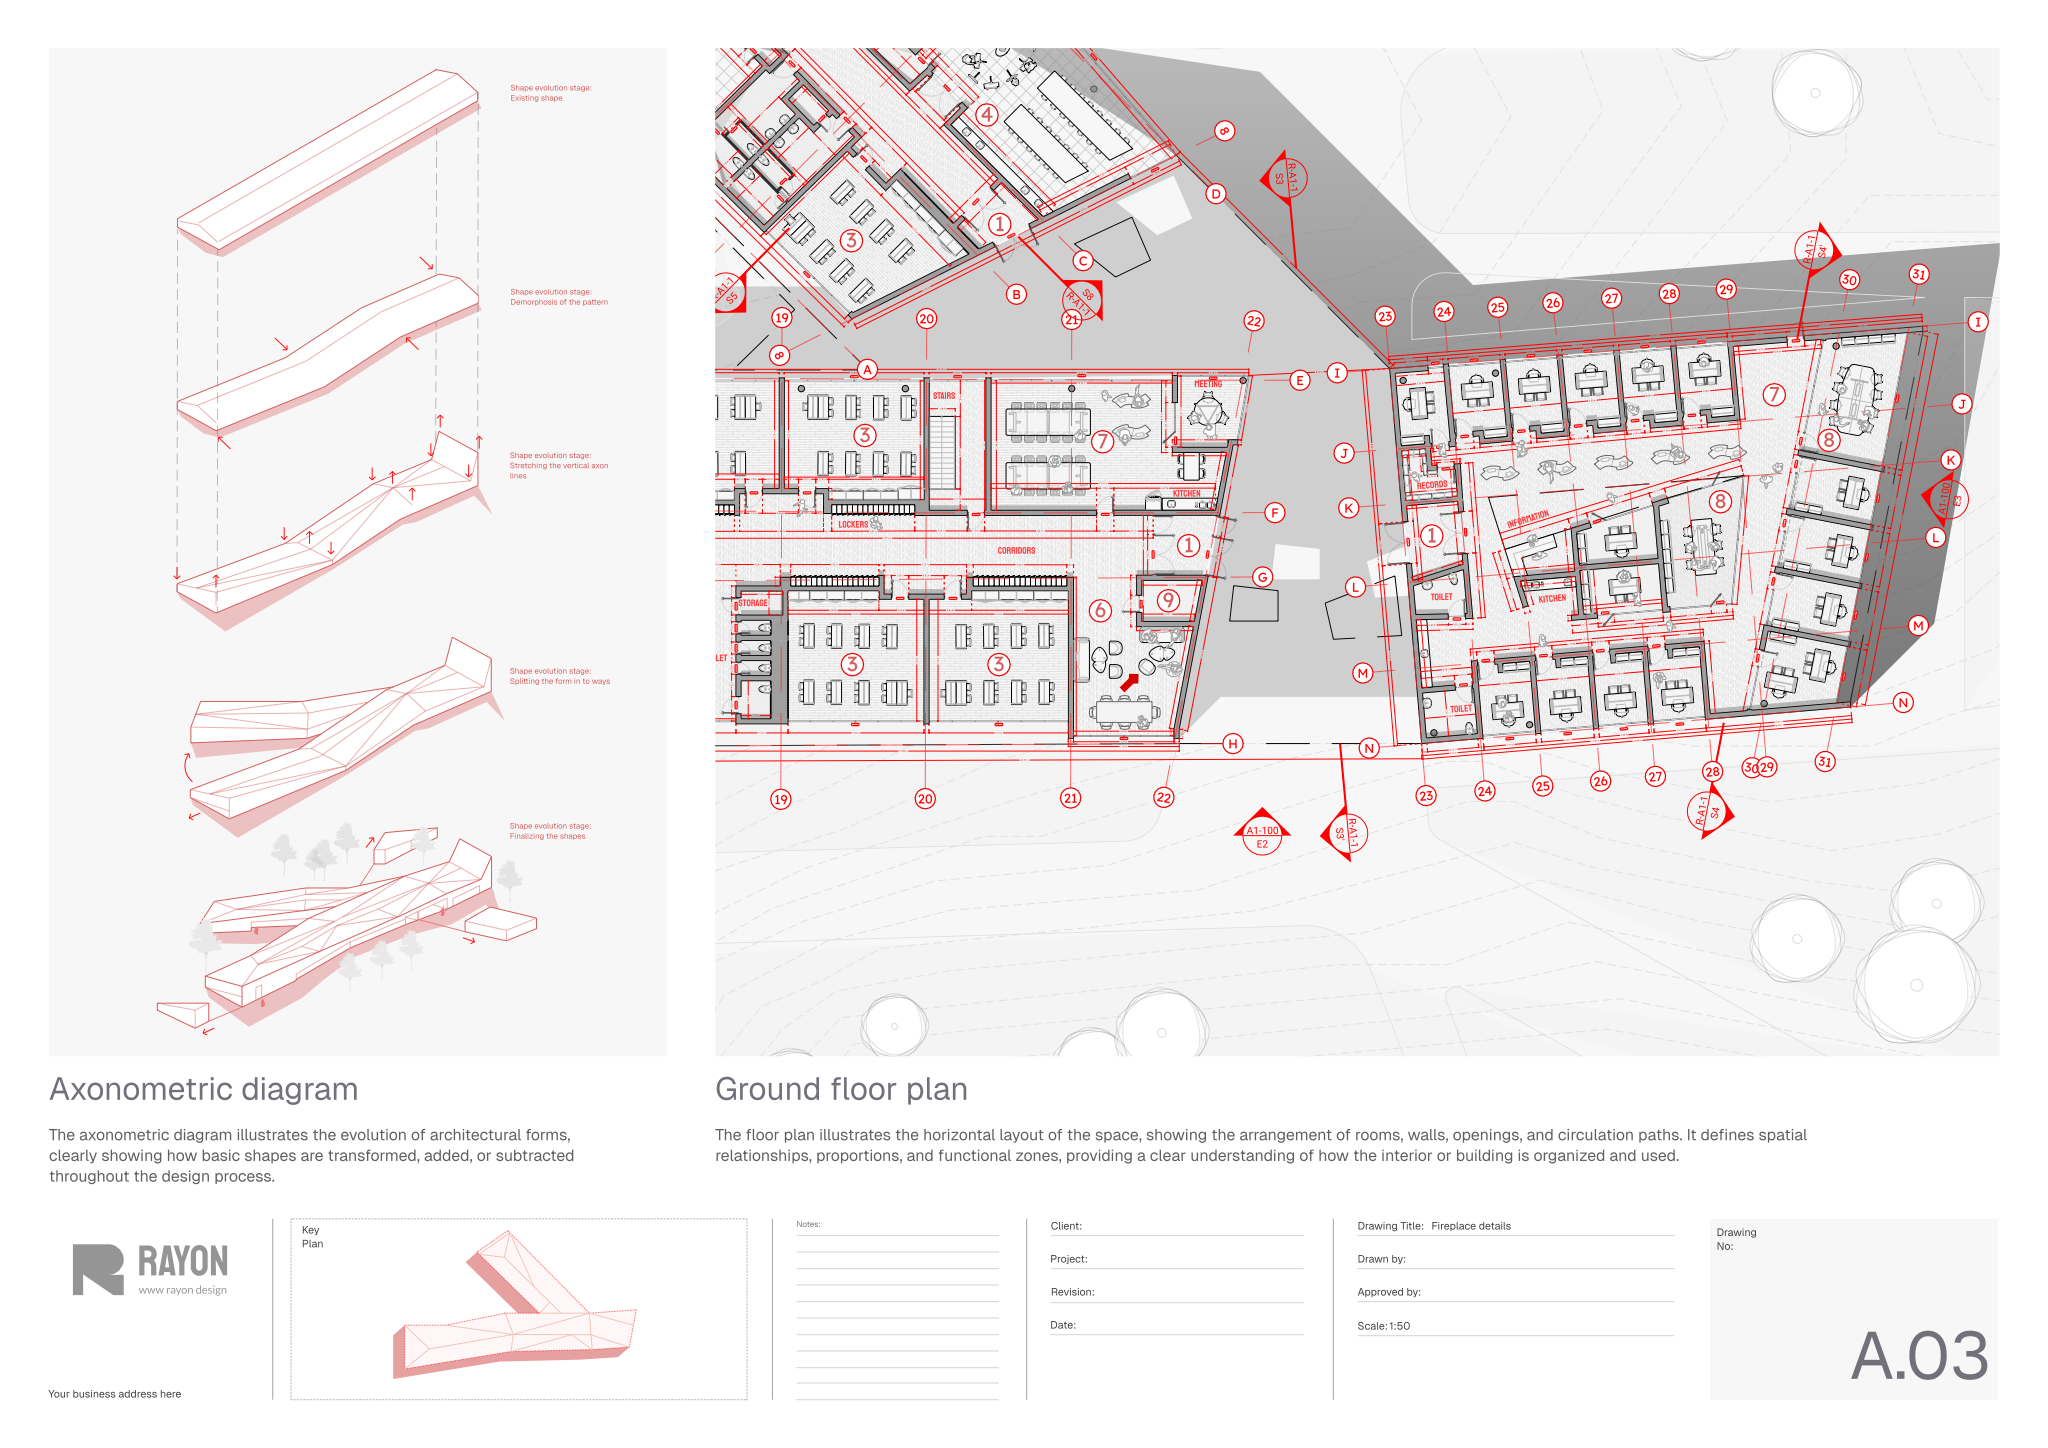
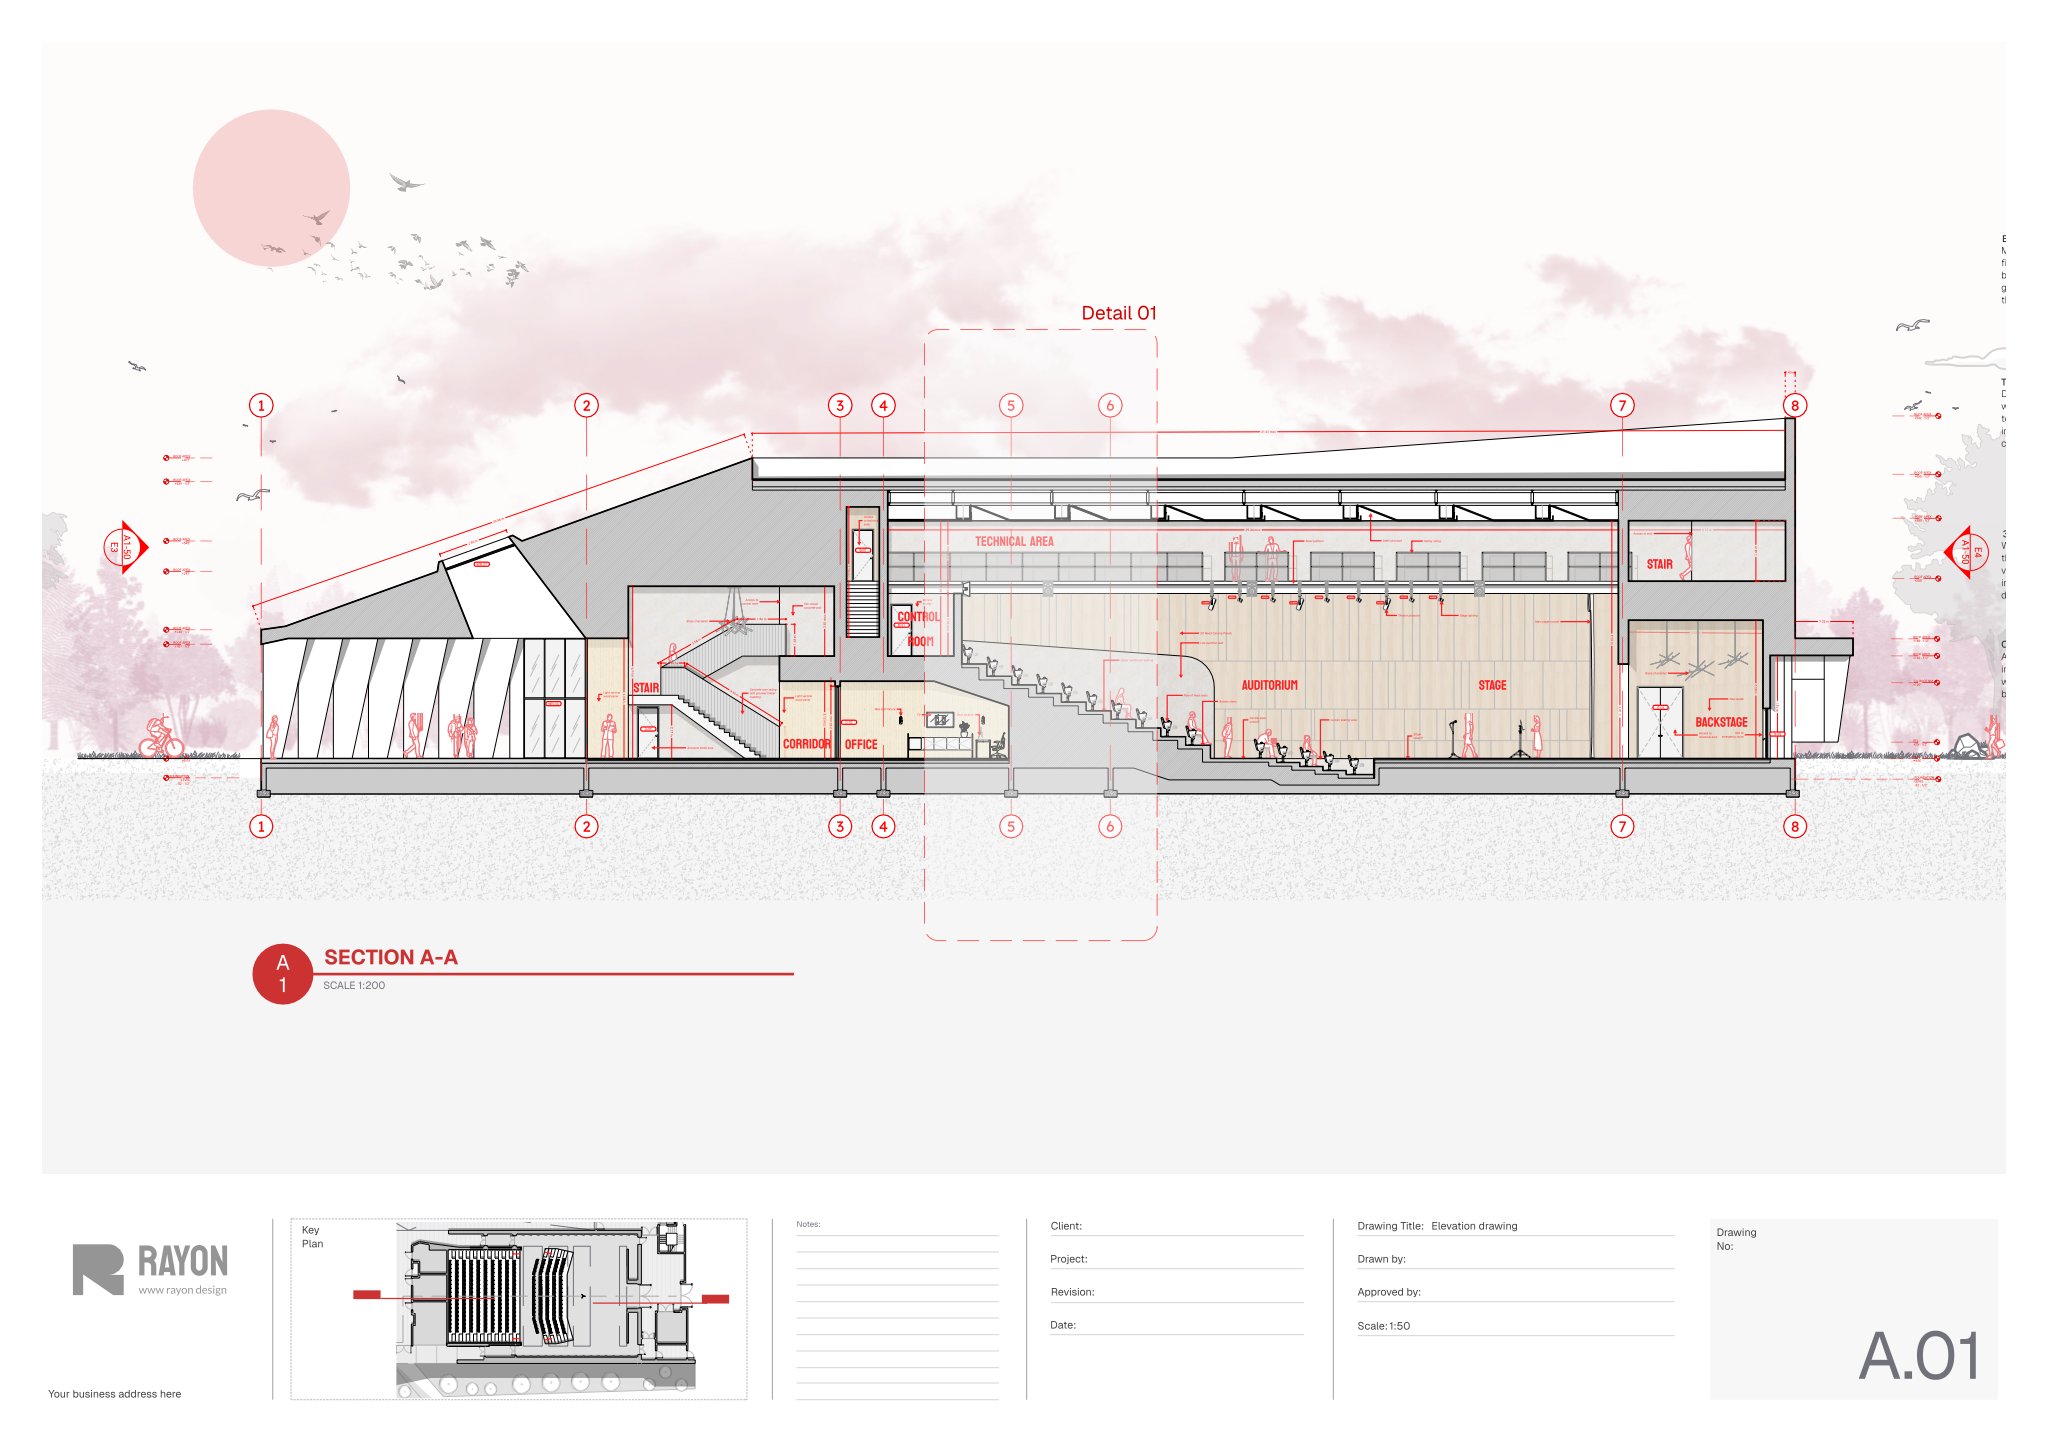
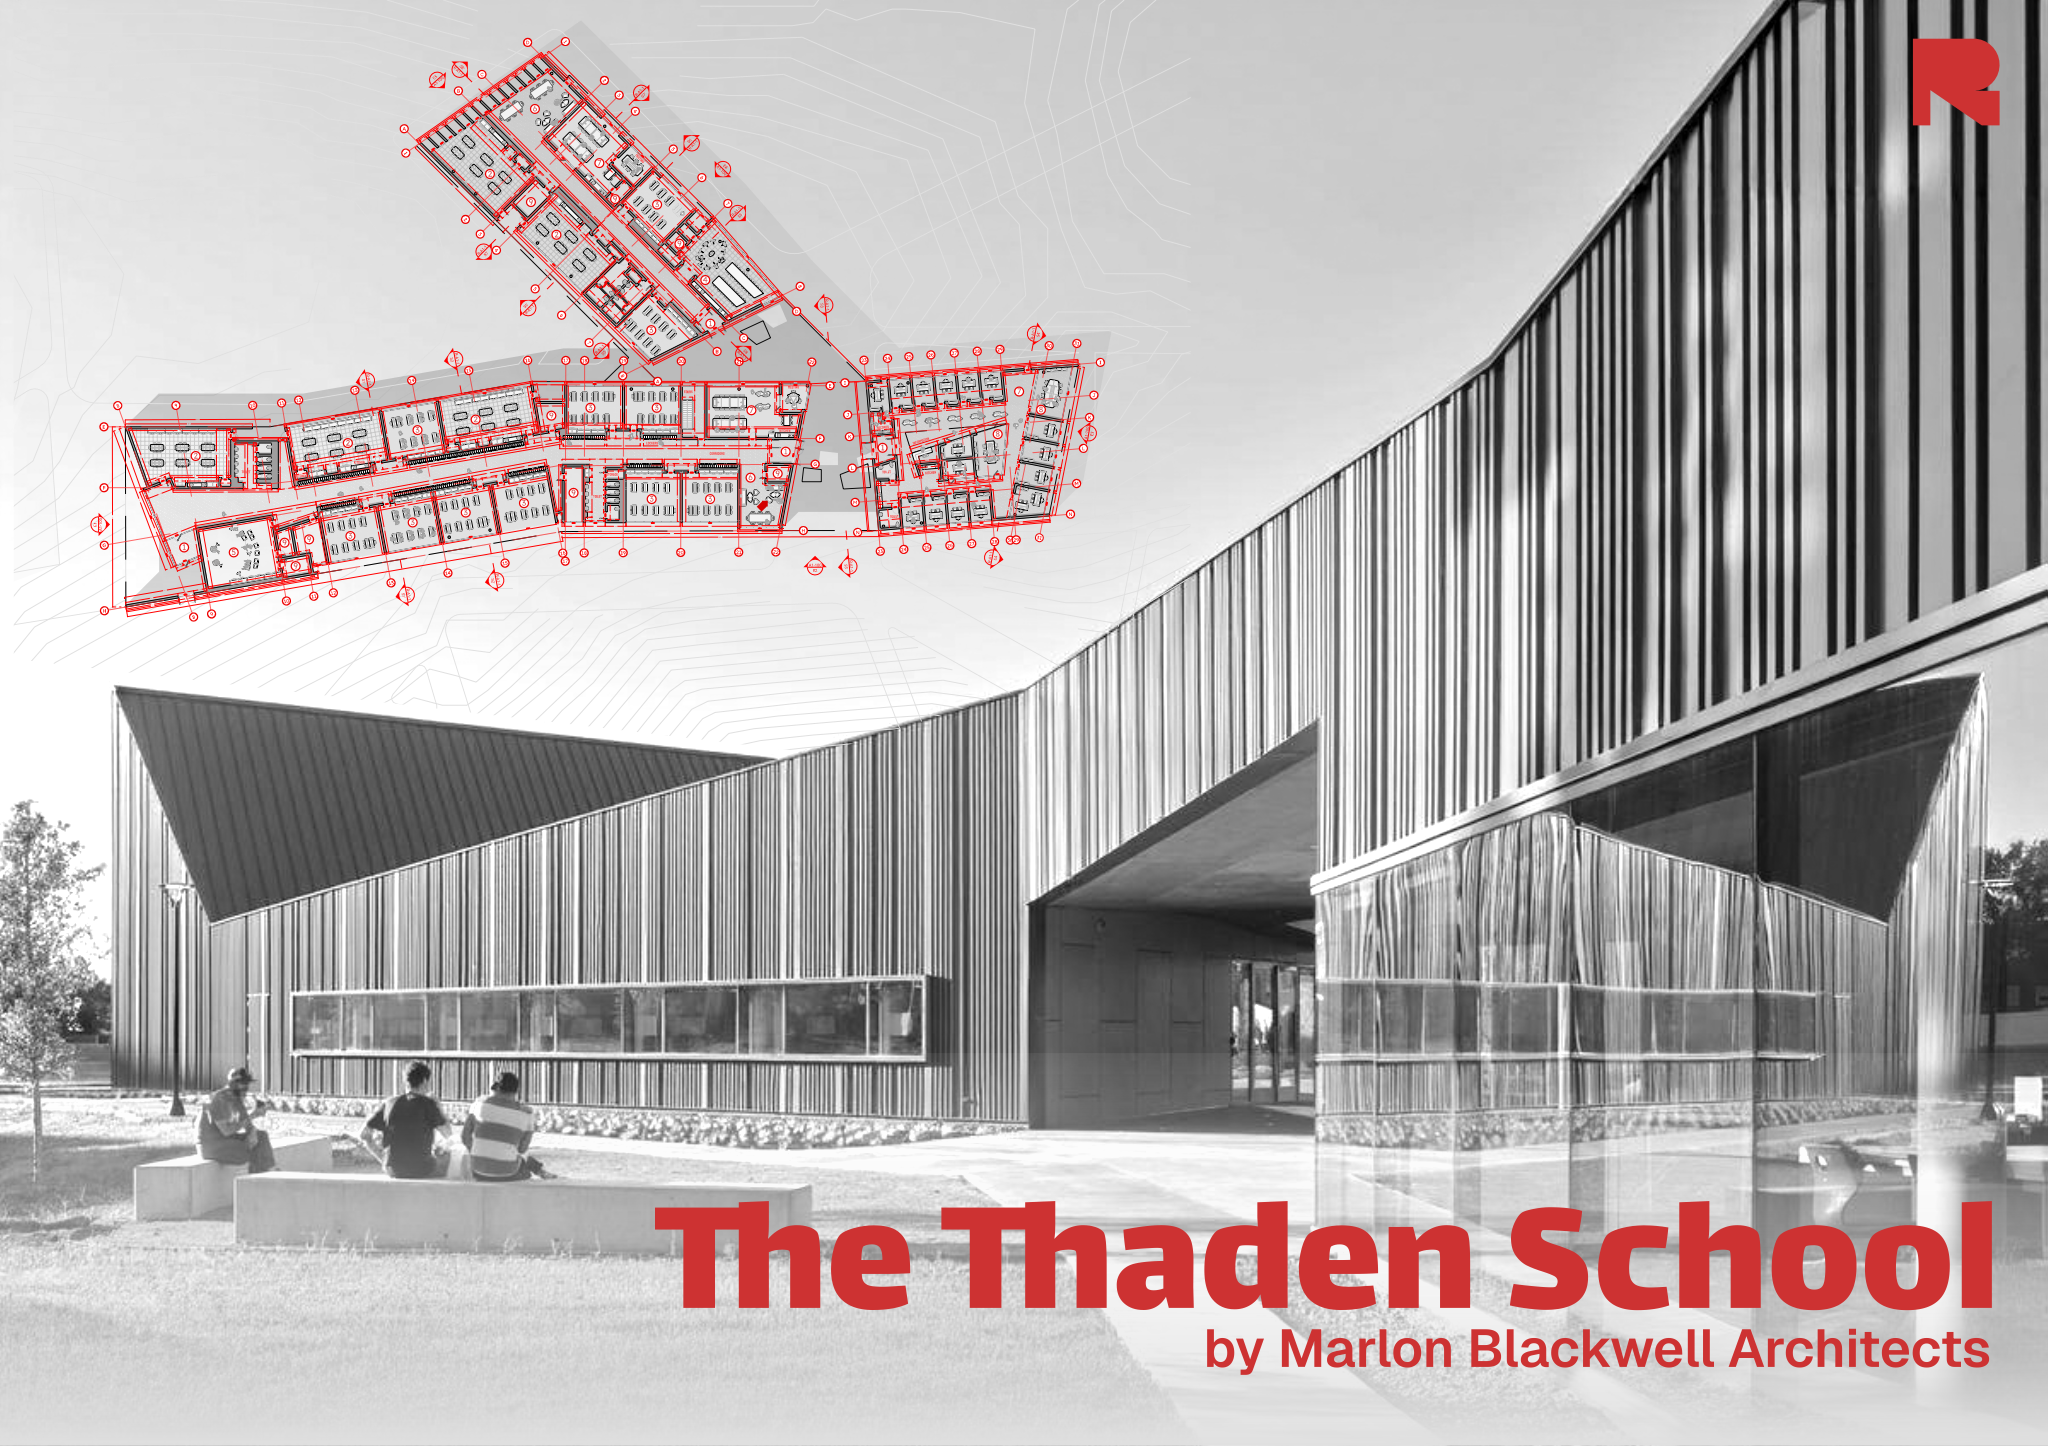
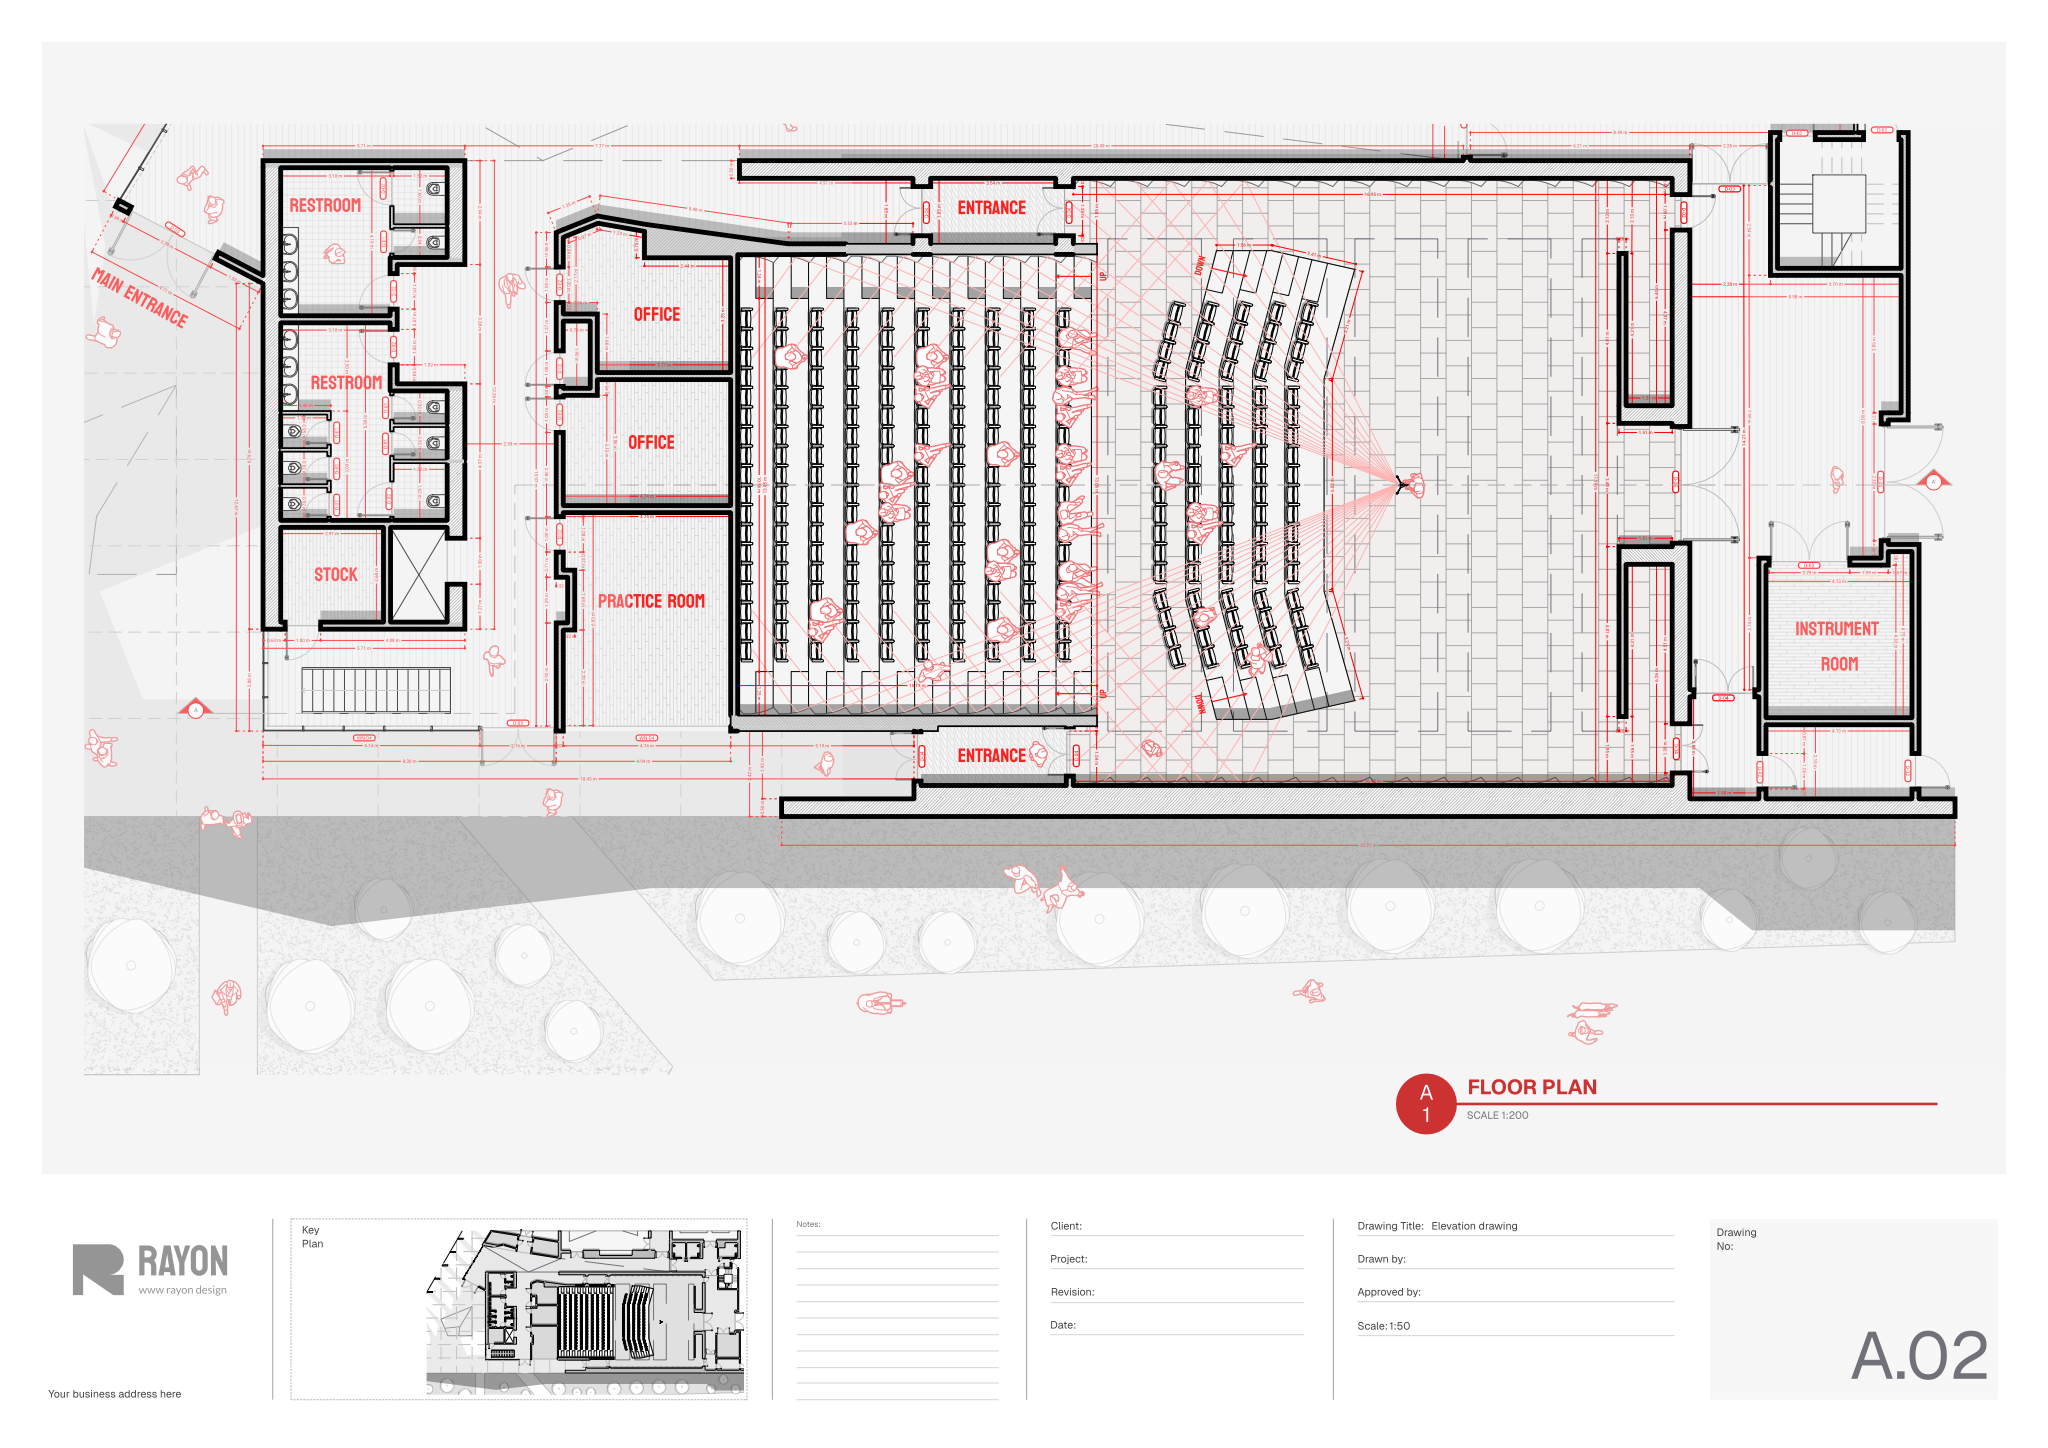
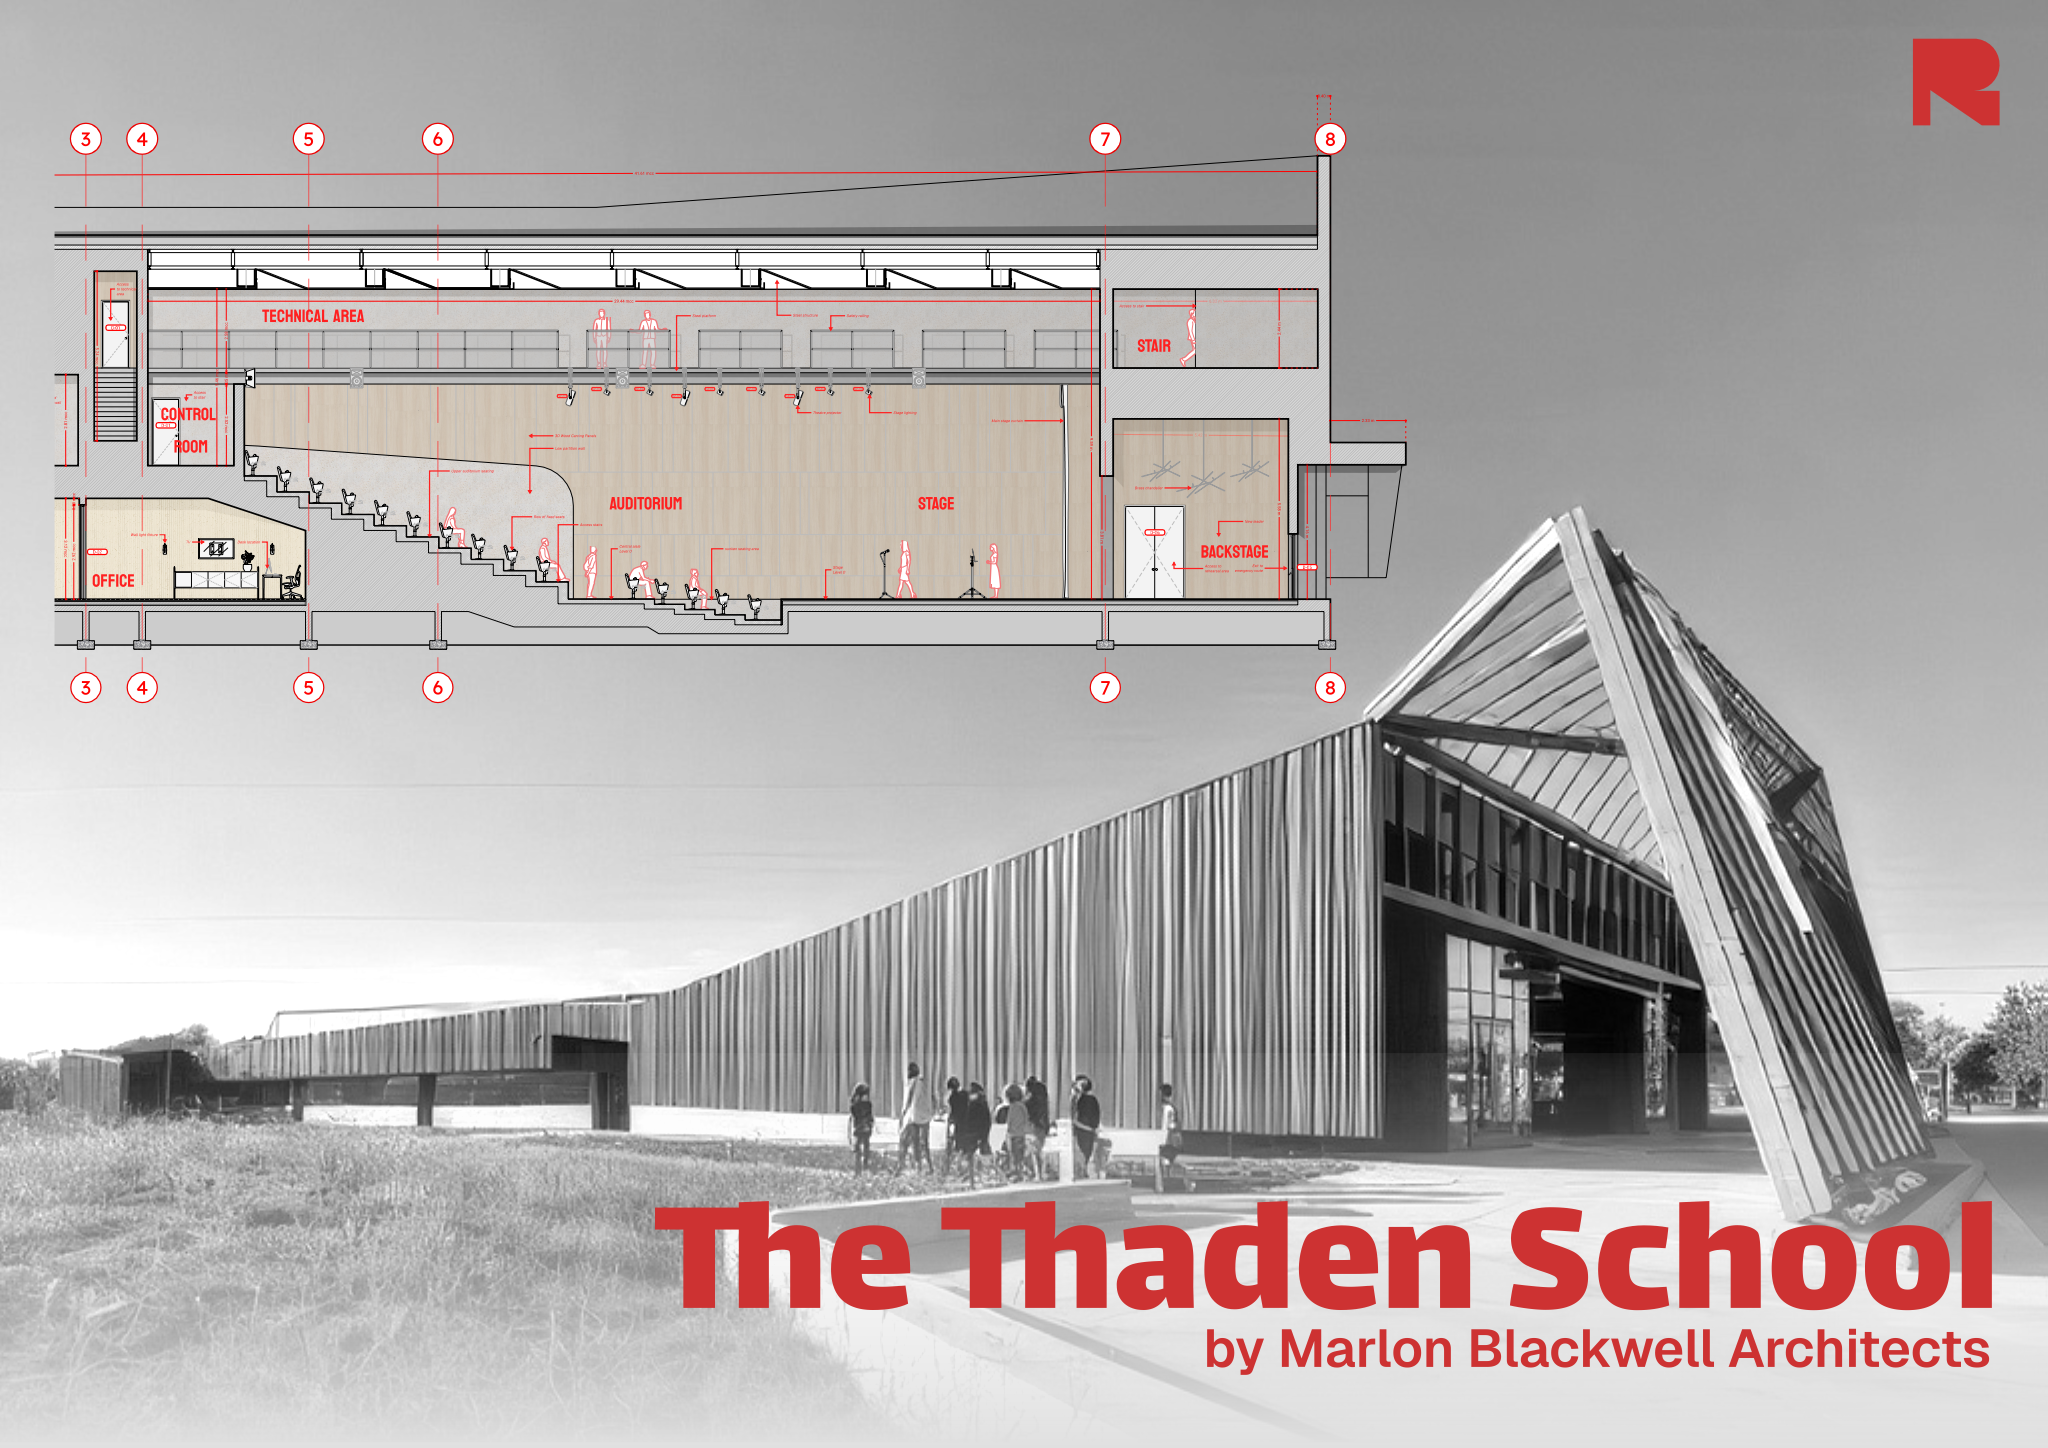
In an architecture student portfolio, a compact site analysis spread before each project shows how you think. Pick the three or four diagrams that most shaped the design rather than including every map. Building-scale layouts, such as an auditorium or campus plan, then show you can carry those ideas into detailed space planning.
- One location map so the reader knows where they are.
- Two or three diagrams of the factors that drove the design.
- The opportunities and constraints plan, simplified.
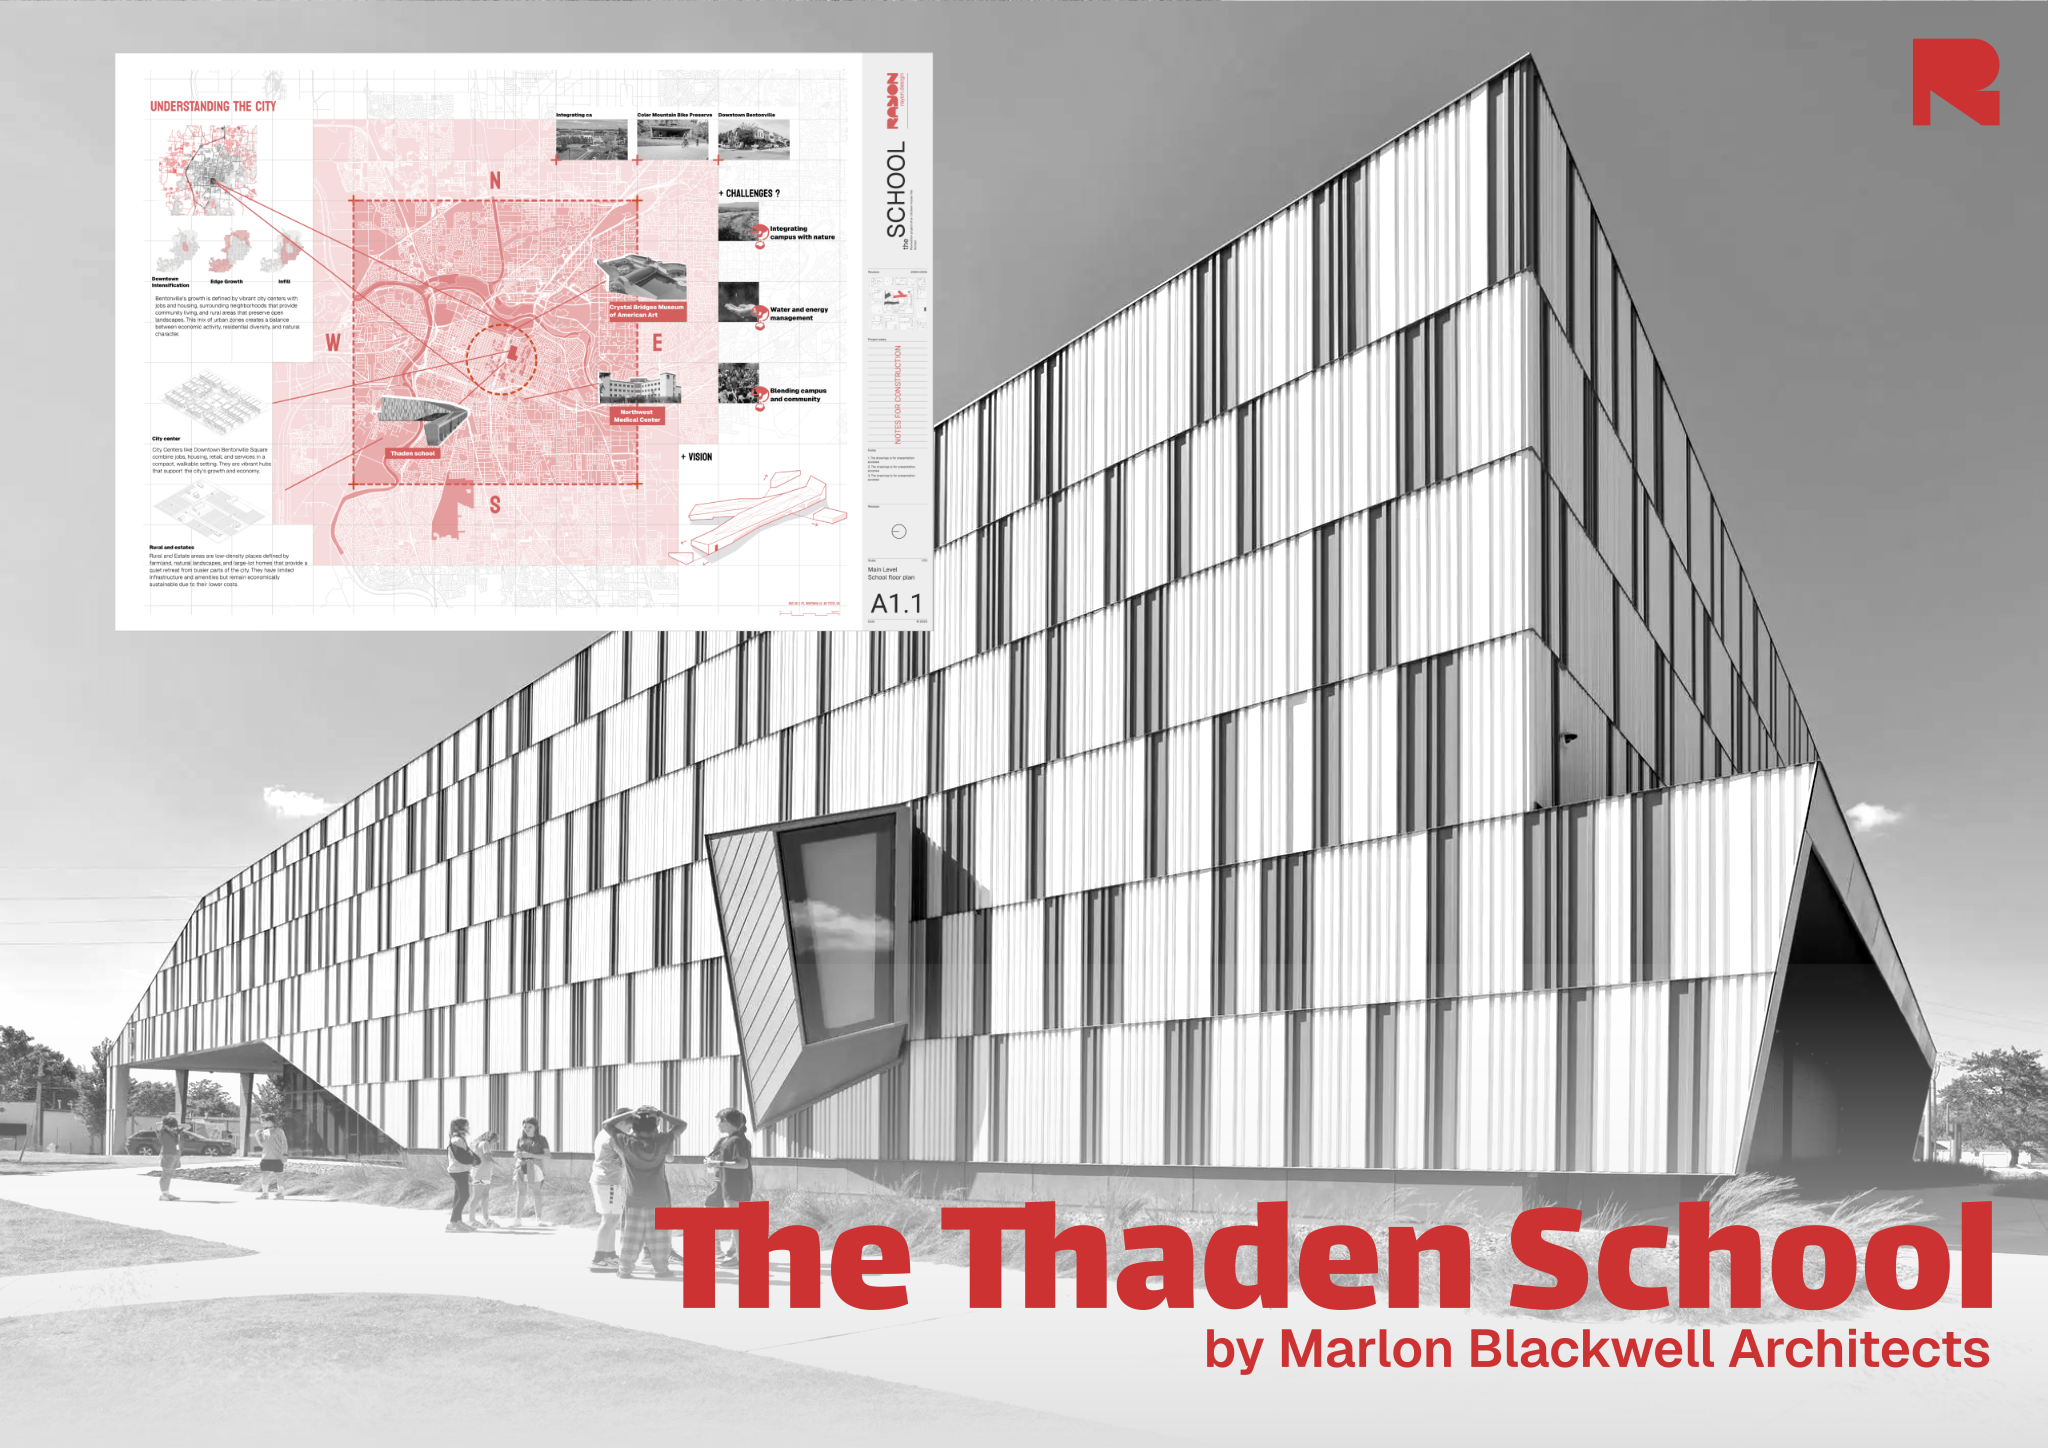
- A site photo or sketch that captures the character of the place.
Watch it on Rayon Academy
Common questions
What is included in a site analysis in architecture?
Context, access and movement, climate and sun path, views, topography, vegetation, noise, existing buildings, regulations and how people use the area, summarised as opportunities and constraints.
How do you present a site analysis?
As a series of single-topic diagrams on the same base map and scale, each with a short takeaway, ending with a combined opportunities and constraints plan.
How many site analysis diagrams do I need?
Enough to explain the design. Typically 6 to 10 for a full project, and the 3 or 4 most important ones in a portfolio.
What is a SWOT analysis in architecture?
A summary of a site's strengths, weaknesses, opportunities and threats. It can be a useful written companion to the opportunities and constraints plan, but the drawn plan is usually more convincing.
Do interior designers need a site analysis?
Yes, at the scale of the building: orientation and daylight, structure, services, entrances, ceiling heights and the surrounding street all shape an interior layout.